Summary
-
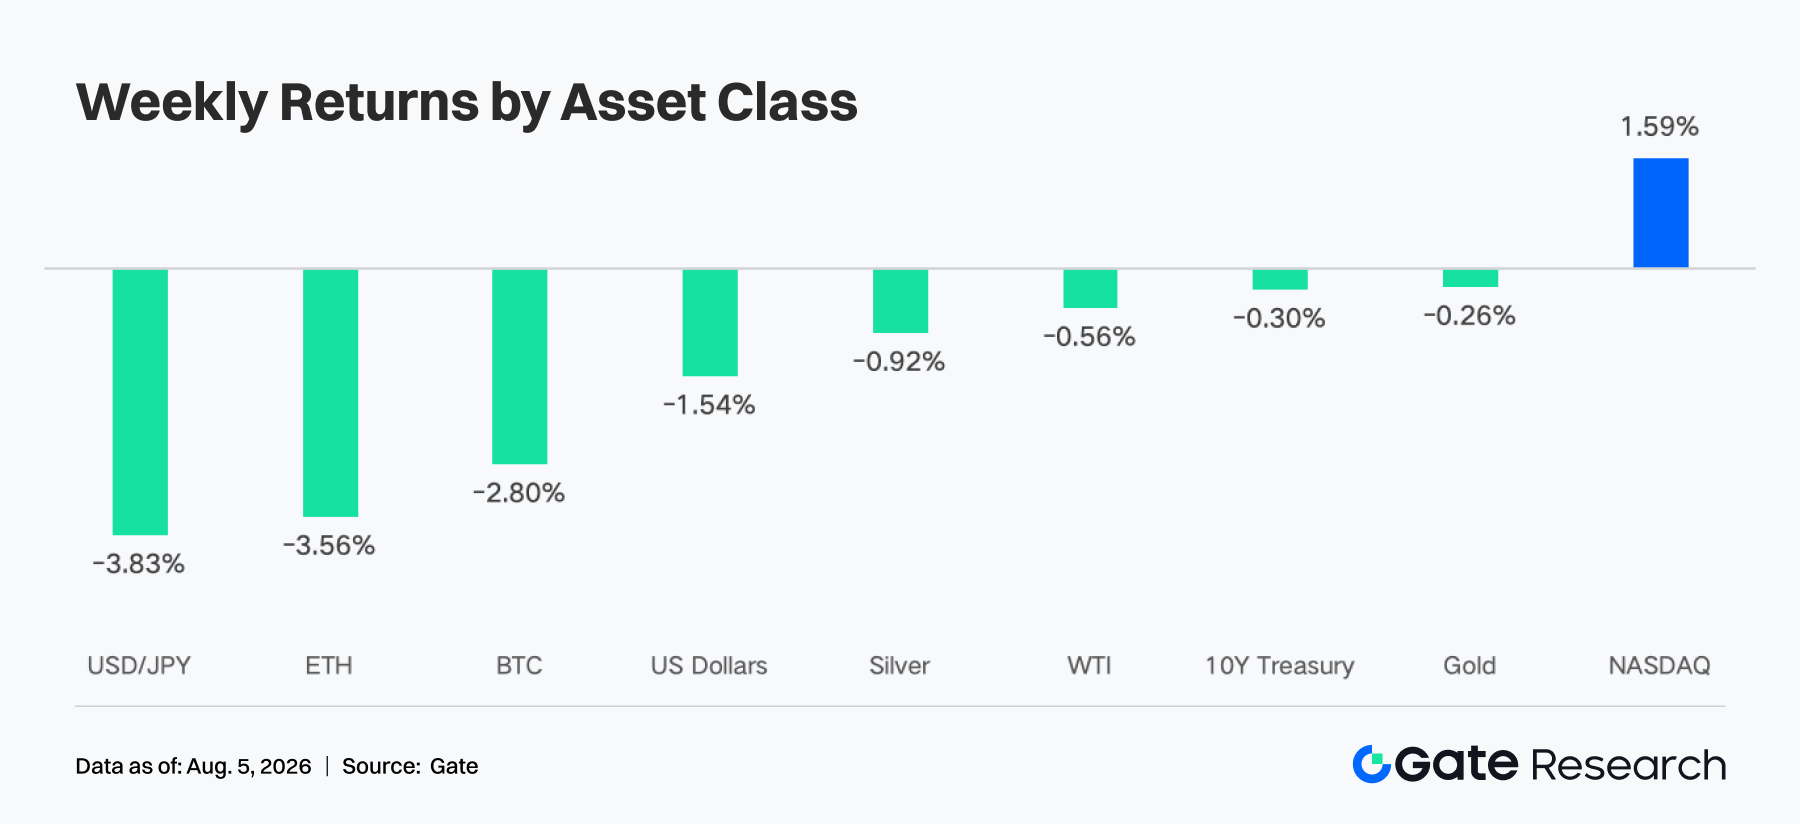
Fed rate-hike risk and stagflation concerns intensified. U.S. equities rose, with the Nasdaq up 1.6%, but high interest rates and deleveraging pressured BTC and ETH performance, with BTC down 2.8% for the week and ETH down 3.56% for the week.
-
BTC ETFs turned to net outflows, while ETH still received slight net subscriptions. Gate TradFi trading approached USD 100 billion, equity capital concentrated toward U.S. and Korean stocks, and the XAUT order book overall maintained strong bid depth, with Delta staying positive for the vast majority of the time.
-
PancakeSwap turnover rose to about USD 16 billion and surpassed Uniswap, while Robinhood Chain, RWA, and PUMP-related Memes became the main sources of short-term traffic. Total stablecoin supply moved sideways with a weak tone, but USDG, RLUSD, and others expanded against the trend.
-
The LST sector pulled back broadly, while ETH staking assets were relatively resilient. Aave lending was supported by Ethereum, Plasma, and Monad, and rates overall remained low. In protocol revenue, Tether and Circle continued to act as the base, while revenues from Memes and trading tools such as Pump increased significantly.
-
BTC rose and then pulled back, while OI fell from above USD 22.5 billion to about USD 22.0 billion, but funding rates remained positive, showing that bulls still held the advantage while leveraged chasing cooled. If BTC falls below USD 63,000, further long deleveraging should be watched closely.
-
On the options side, volume expanded at month-end and then quickly fell back, while monthly contracts still dominated. 25D Skew weakened again, protective demand rebounded, and DVOL fell to about 35. The market still priced high-level consolidation overall, but a breakout from the USD 63,000-66,000 range could trigger a rapid rebound in volatility.
1. Market Focus Analysis
Last week (July 27 to August 2, 2026), the market repeatedly traded around Fed policy, U.S. economic 'stagflation' risk, and the Middle East situation. The Fed kept the target range for the federal funds rate at 3.50%-3.75% for the fifth consecutive time, but three officials supported a rate hike, reflecting that policymakers' vigilance against a renewed rise in inflation had clearly increased. U.S. real GDP grew at an annualized rate of 1.5% in the second quarter, lower than 2.1% in the first quarter, but consumer spending grew 3.2%, showing that the economy slowed while domestic demand remained resilient. Headline PCE rose 3.7% year on year in June, and core PCE rose 3.3% year on year, both significantly above the Fed's 2% target.
Asset prices therefore showed high volatility. The 10-year U.S. Treasury yield fell from 4.69% to 4.65% at the start of the week, then rose to about 4.73% on the back of inflation and rate-hike expectations, pressuring high-valuation assets. Expectations of a Middle East ceasefire once pushed Brent crude down 6.3% to USD 85.87, but repeated conflict drove oil prices back up to around USD 87.93. Gold was supported by geopolitical safe-haven demand, but high real interest rates limited its upside room. U.S. equities repaired on the back of AI-sector volatility and strong earnings from major technology companies, with the S&P 500, Dow, and Nasdaq up 1.0%, 1.0%, and 1.6% for the week, respectively. The crypto market failed to benefit in sync, as higher risk-free yields, inflation pressure brought by oil prices, and derivatives deleveraging jointly pressured risk appetite, and both BTC and ETH fell with volatility during the week.
2. Liquidity Analysis
2.1 ETH ETFs still retained slight net subscriptions, and institutional sentiment was relatively more resilient
In the previous week, U.S. spot BTC ETFs recorded total net outflows of about USD 62 million, clearly weakening from net inflows of USD 34 million in the week before, showing that capital direction shifted from slight accumulation to reduction. At the product level, IBIT recorded net inflows of about USD 87 million for the week, making it the strongest product in attracting capital, while FBTC recorded net outflows of about USD 85 million, making it the weakest performer. Intraweek flows fluctuated significantly: net inflows once reached USD 233 million on Thursday, followed immediately by net outflows of USD 265 million on Friday, showing that institutional trading was more event-driven and lacked willingness to chase higher continuously.
ETH ETFs still recorded net inflows of about USD 10 million for the full week, but this plunged about 90.37% from USD 104 million in the previous week. ETHA recorded net inflows of about USD 37 million and continued to serve as the main absorbing force, while FETH recorded net outflows of about USD 21 million, the largest outflow among products. Because precise public AUM aggregates at a unified point in time are unavailable, a proxy measure of 'last week's estimated AUM x token price change + this week's net flows' is used: BTC ETF AUM fell from about USD 78.30 billion to USD 76.046 billion, down about 2.88% week on week; ETH ETF AUM fell from about USD 10.10 billion to USD 9.751 billion, down about 3.46% week on week. The AUM decline in both was mainly driven by falling token prices, but BTC also faced net redemptions, indicating more defensive sentiment, while ETH still retained slight net subscriptions, and institutional sentiment was relatively more resilient.
2.2 TradFi Liquidity
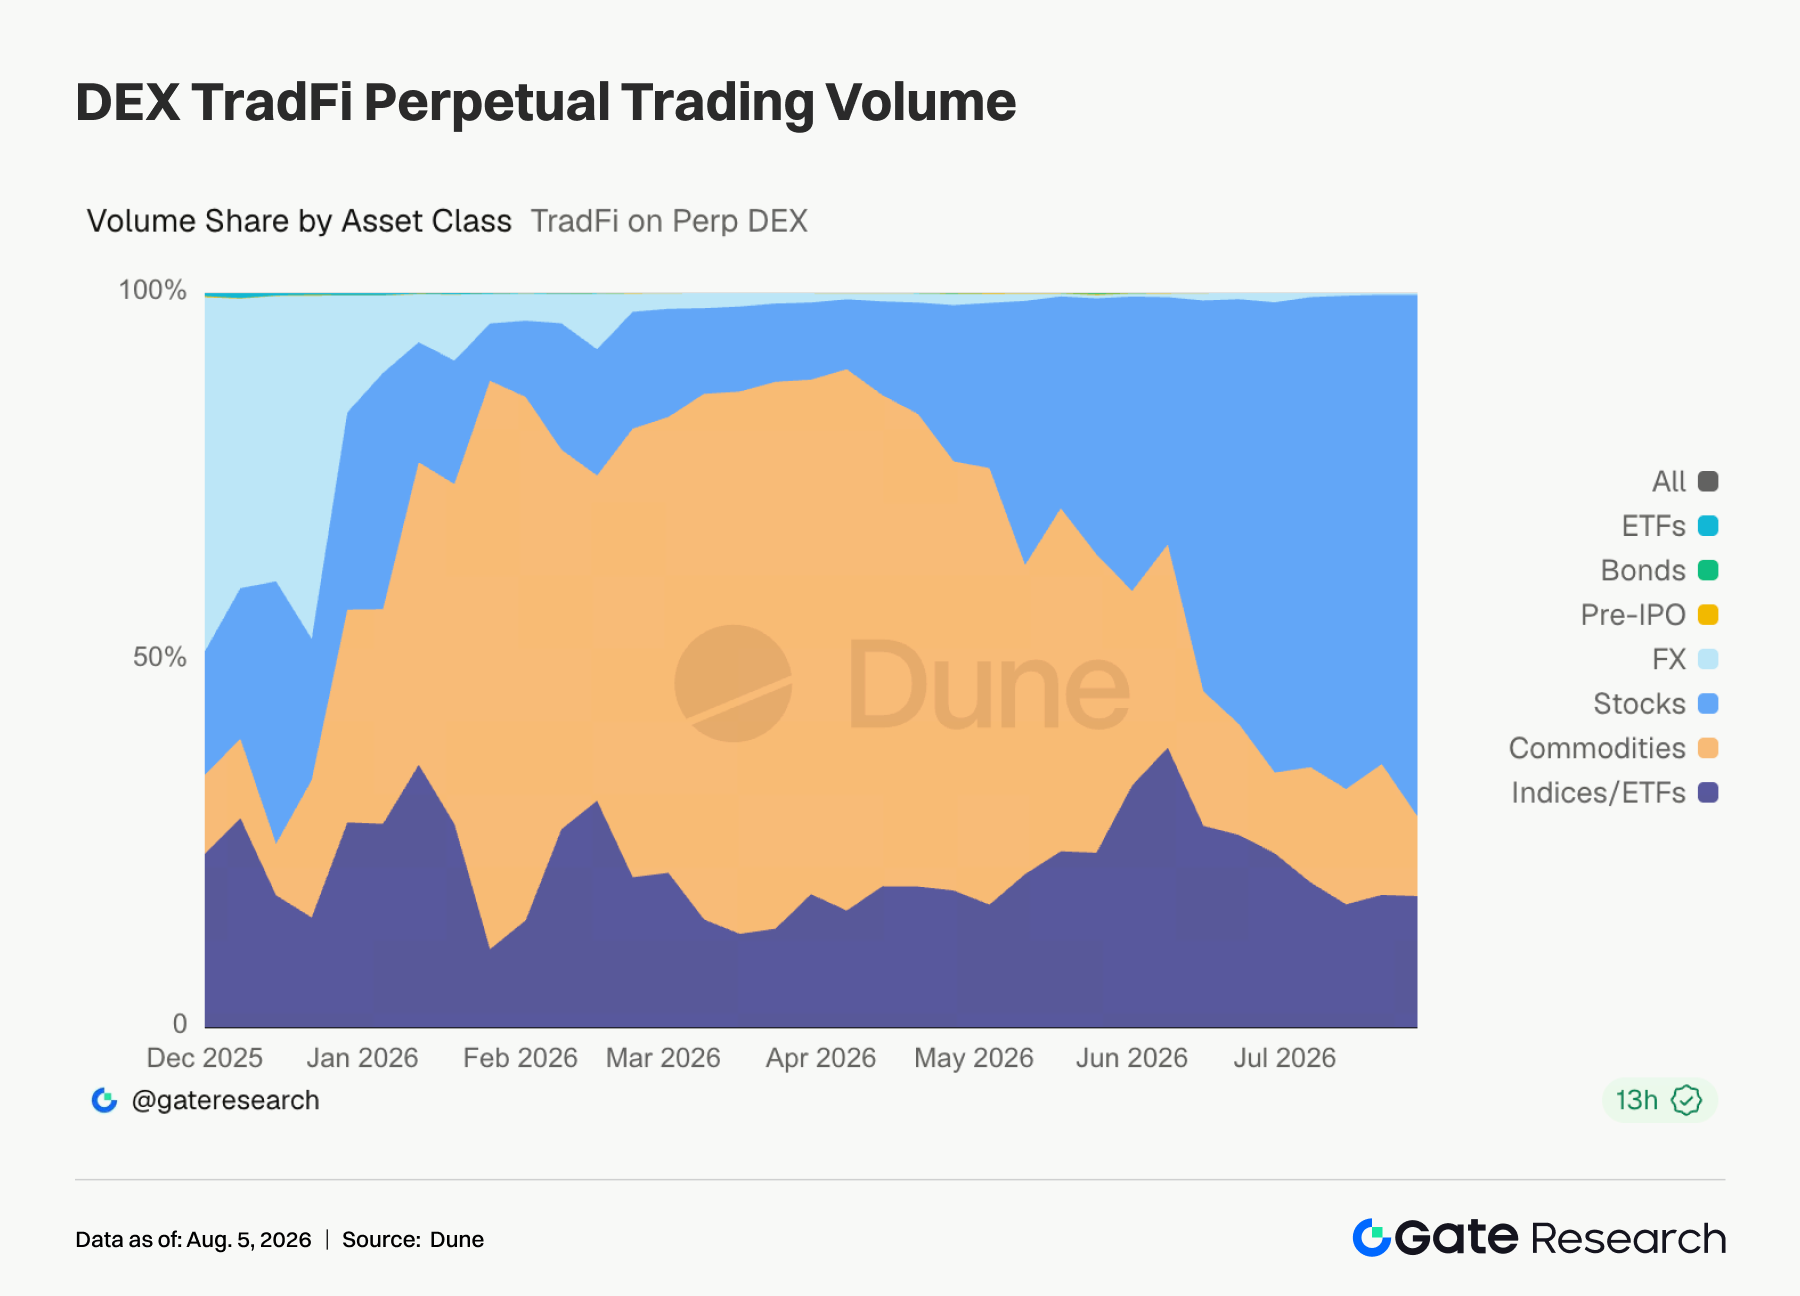
- TradFi Perp DEX: Over the past week, the TradFi trading structure across the entire platform continued to concentrate clearly toward equity assets. The share of equity trading volume kept rising from about 60% in early July to nearly 70% by the end of July, becoming the platform's most important TradFi trading category. Commodity trading continued to cool, with its share falling from about 30%-40% previously to about 10%, indicating that the earlier trading heat driven by assets such as gold and crude oil weakened significantly. The share of indices/ETFs remained at about 15%-20%, overall relatively stable, and continued to serve important diversified allocation demand. By contrast, the shares of foreign exchange, bonds, and Pre-IPO trading remained low. Overall, platform TradFi capital has been rotating back from commodity assets that were active in stages into the equity market, and the trading structure has further concentrated toward equity assets.
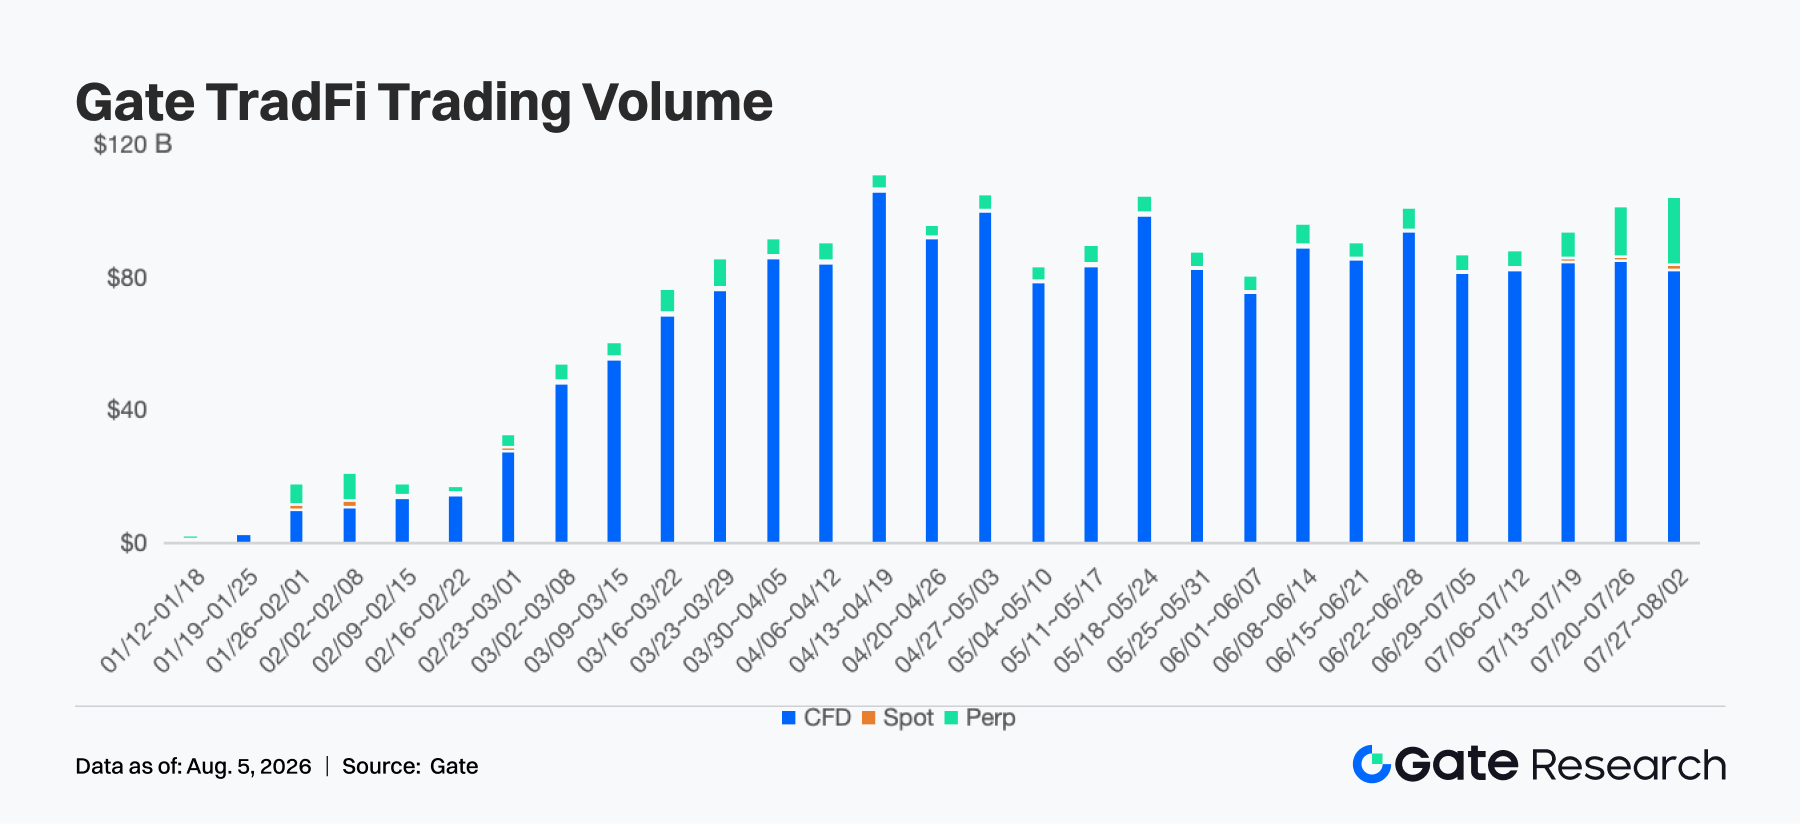
- Gate TradFi Trading Volume: Over the past week, Gate TradFi weekly trading volume continued to remain at a high level, overall around USD 100 billion, growing further from the previous week and approaching the earlier cyclical high. From the trading structure perspective, CFDs still held an absolute dominant position, contributing more than USD 80 billion in trading volume, while Perp trading volume continued to grow and its share increased further. Overall, after the earlier period of rapid expansion, Gate TradFi weekly trading scale has remained above USD 80 billion for several consecutive weeks and has recently moved back toward the USD 100 billion level, showing that trading activity and user participation in TradFi products remained strongly resilient.
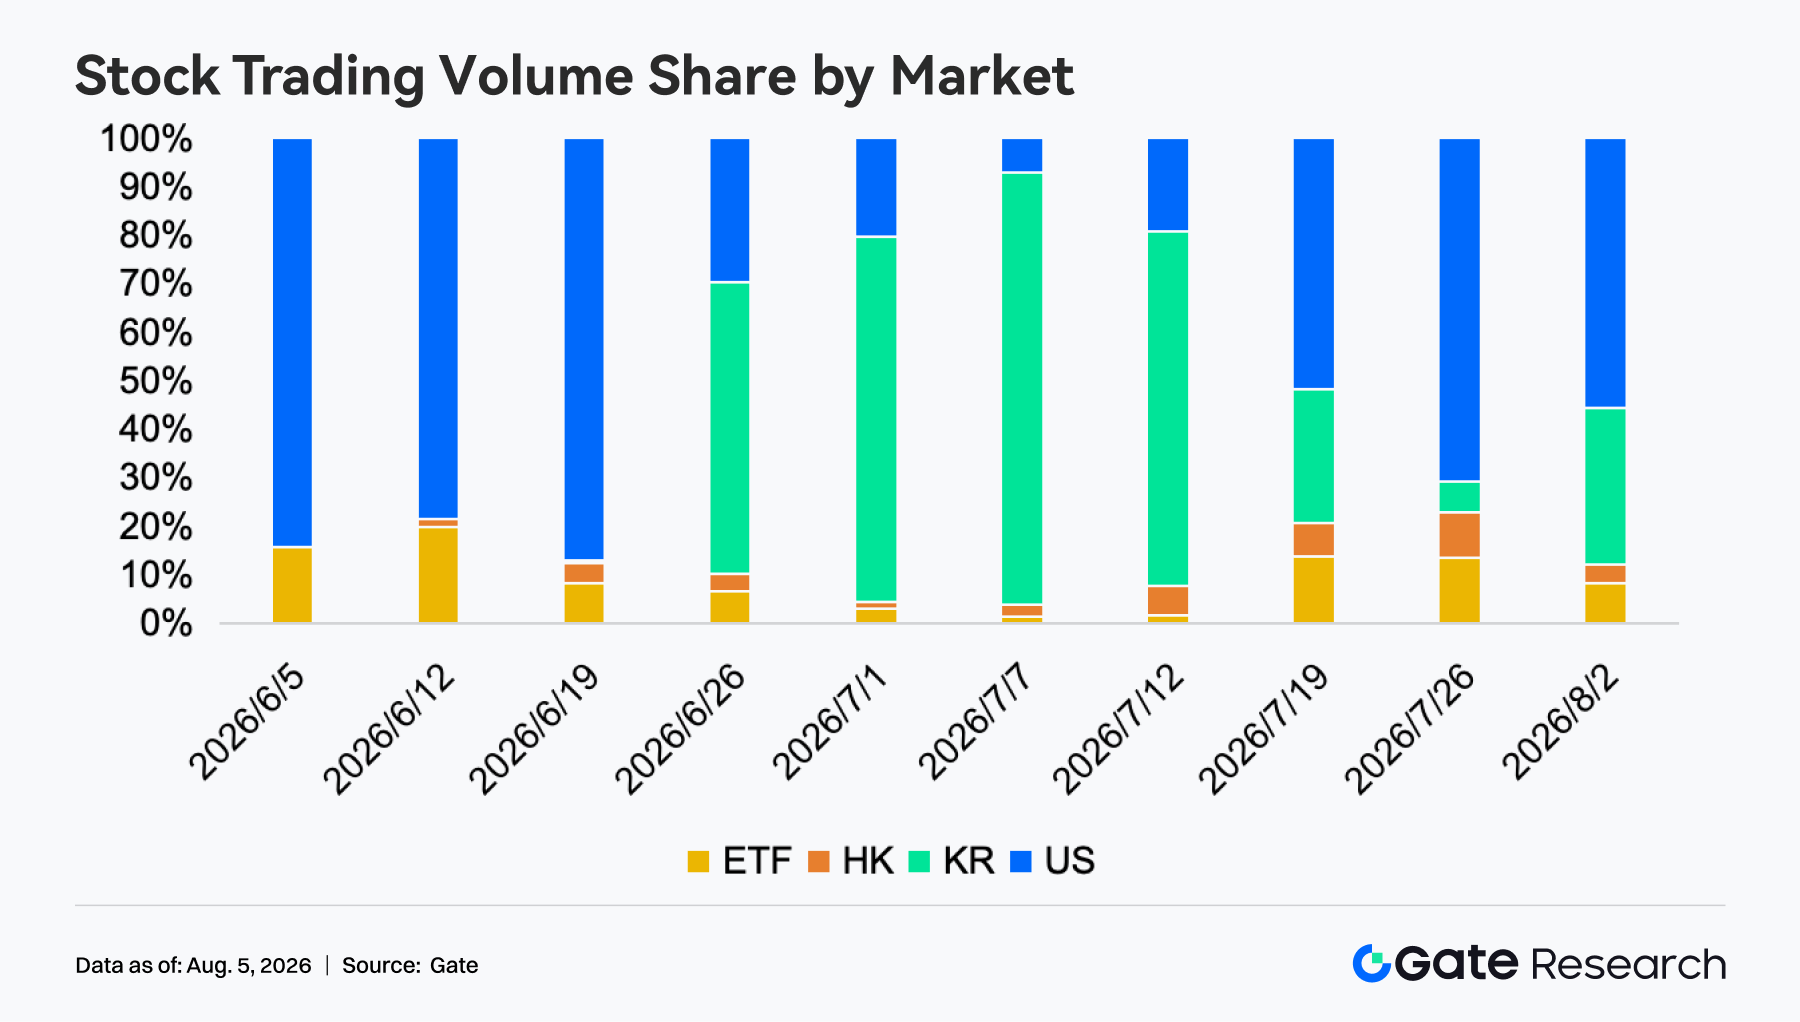
- Gate Equity Asset Trading Volume: Over the past week, the trading structure of Gate equity assets underwent another significant adjustment. U.S. equities remained the largest trading market, but their share fell from about 71% in the previous week to about 56%. The share of Korean equity trading, by contrast, quickly rebounded from about 7% to about 32%, becoming the main source of incremental growth this week. At the same time, the ETF share fell from about 14% to about 8%, while the share of Hong Kong equities remained around 4%. Overall, equity trading capital shifted from a previous high concentration in U.S. equities back to a dual mainline of U.S. and Korean equities. The core position of U.S. equities did not change, but trading heat in the Korean market recovered significantly, reflecting a clear increase in users' rotational trading across regional equity assets.
- TradFi Order Book Depth: We selected XAUT, which had the highest TradFi trading volume, to analyze its order book depth (Delta). Over the past week, the XAUT order book overall maintained strong bid depth, with Delta remaining positive for the vast majority of the time. From July 28 to July 30, bid depth repeatedly approached or exceeded USD 1 million, and only in a few periods did it briefly turn negative. XAUT prices mainly fluctuated in the USD 4,020-4,100 range. On August 3, bid depth quickly rose to about USD 1.5 million, showing that support below strengthened clearly, and overall liquidity still leaned bullish.
3. On-Chain Data Insights
3.1 PancakeSwap leads, while Robinhood Chain and PUMP continue to provide short-term traffic
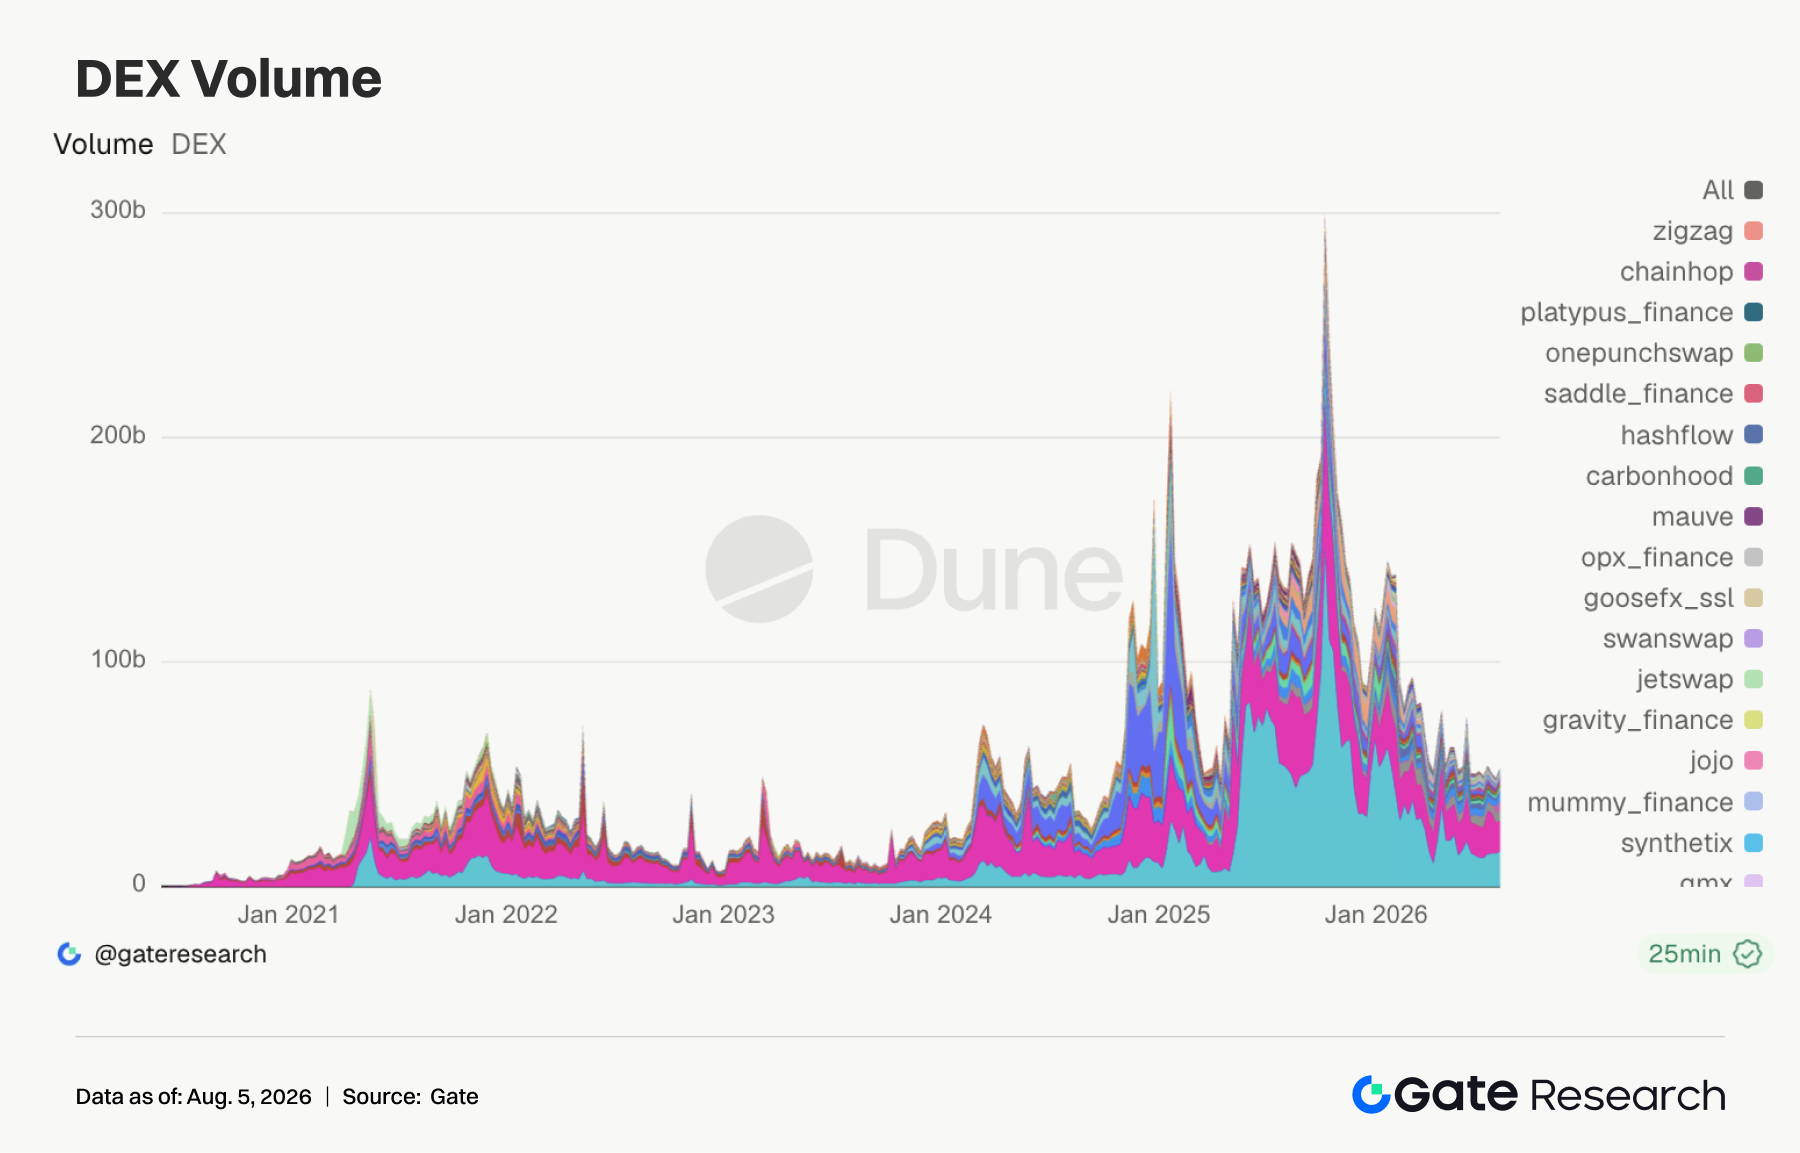
This week, DEX activity was simultaneously driven by PancakeSwap, Robinhood Chain/RWA-related trading, and PUMP-related Memes. PancakeSwap turnover rose to about USD 16.02 billion, up about 7.6% from the previous week and above Uniswap. Uniswap turnover was about USD 13.57 billion, down slightly, but still remained at a high level. Robinhood Chain-related themes continued to develop: Pons v2 launched and deeply integrated Uniswap V4, supporting newly issued tokens to be paired directly with tokenized stocks. Over the past two weeks, Pons issued more than 210,000 tokens and generated more than USD 283 million in trading volume in Uniswap pools. Native turnover rose to about USD 4.34 billion, and Aerodrome also rebounded significantly, showing that RWA, on-chain equities, and Base/Ethereum-related liquidity were absorbing capital. PumpSwap turnover rose to about USD 4.51 billion, while both Pump.fun turnover and trader count rebounded together, showing that Meme trading remained active. However, Meteora and Whirlpool were generally weak, and the Solana side did not form a full recovery.
3.2 Stablecoin supply moved sideways with a weak tone, while scenario-based assets such as USDG and RLUSD expanded against the trend
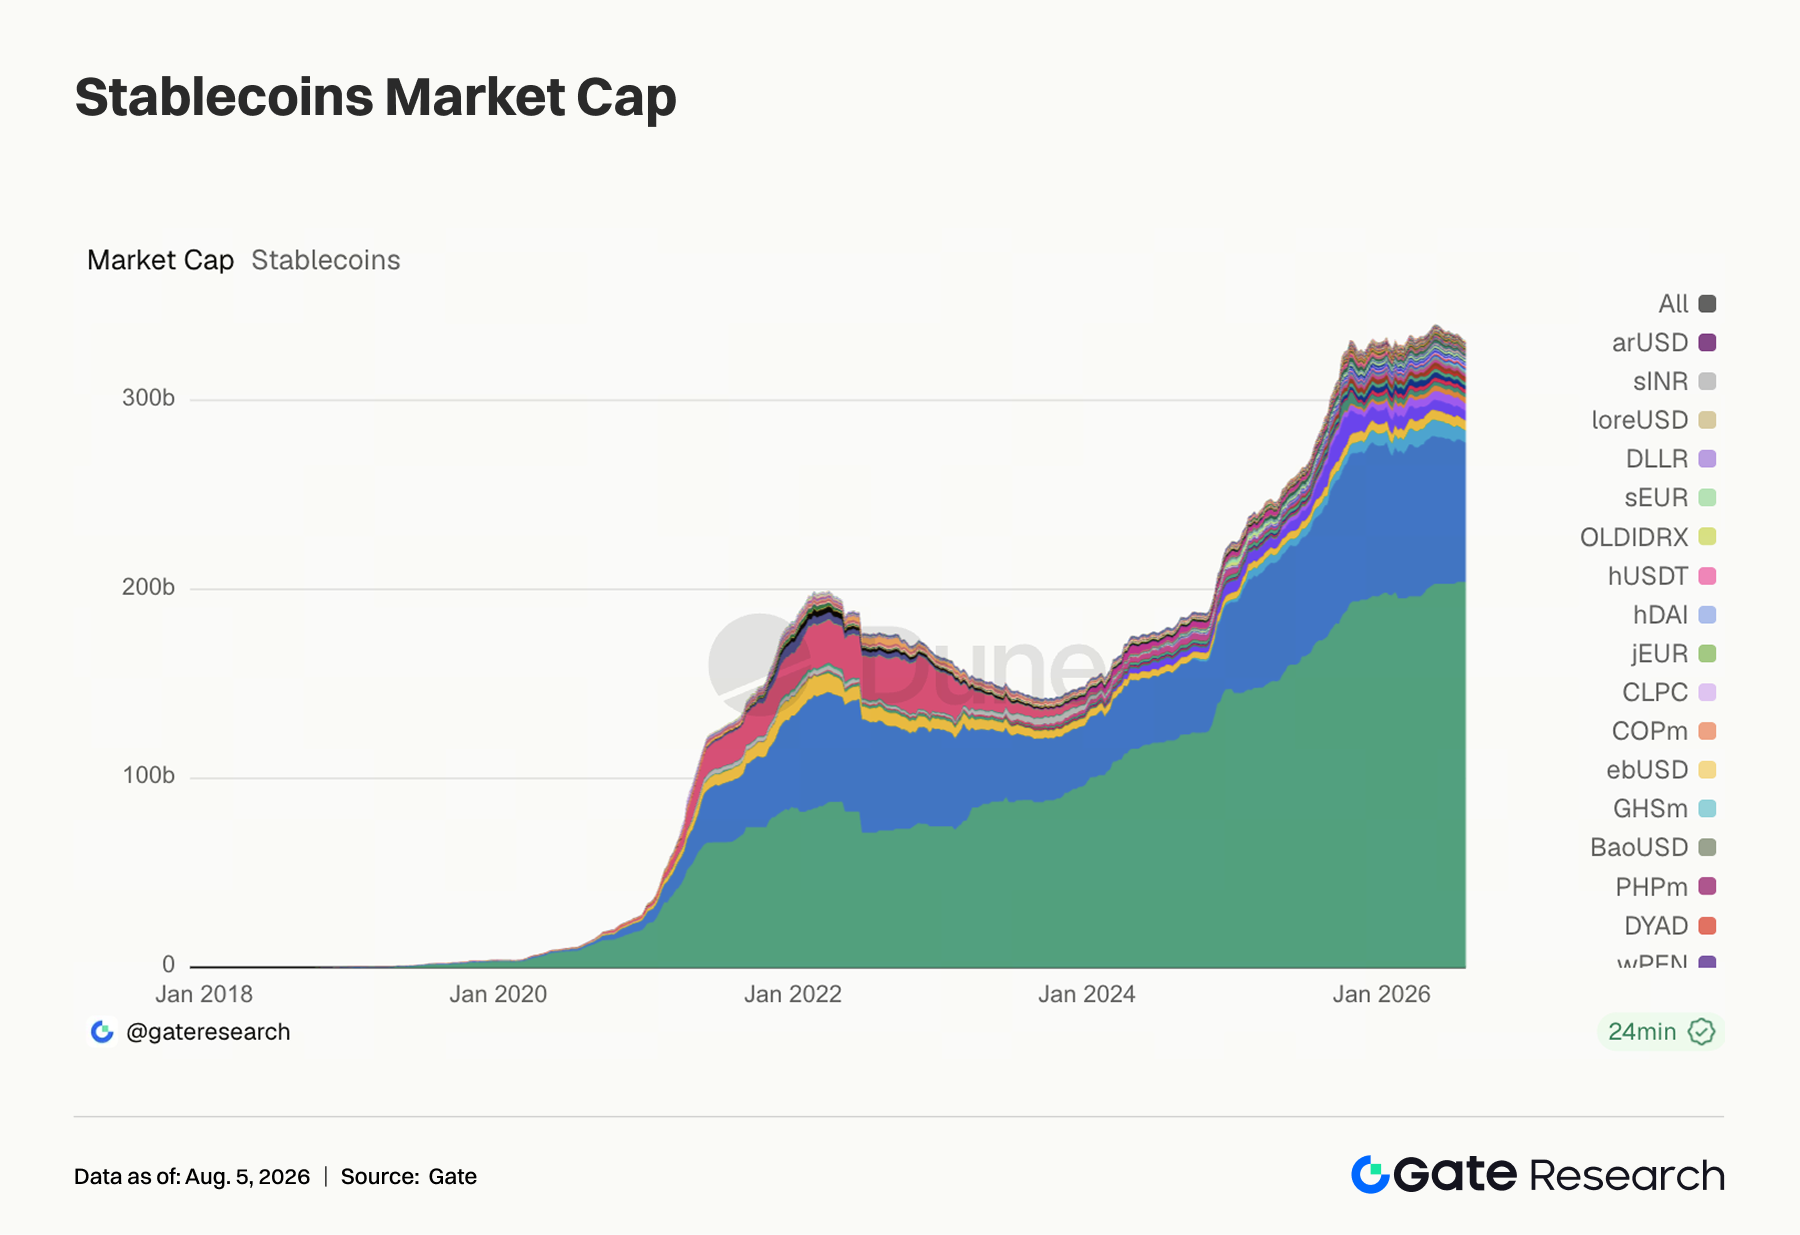
This week, USDT was basically flat, while USDC fell slightly from about USD 74.45 billion to USD 73.8 billion, and leading stablecoins did not see obvious new U.S. dollar inflows. USDe, USD1, USDS, and DAI all retreated slightly, and the expansion momentum of yield-bearing and protocol-based stablecoins continued to slow. Relatively stronger performers were USDG, PYUSD, USDD, RLUSD, and EURC, among which USDG rose to about USD 3.08 billion and RLUSD rose to about USD 700 million. Over the past week, Robinhood Chain application deposits exceeded USD 600 million, and part of the incremental growth came from Robinhood Earn's yield appeal for USDG, shifting the core of the stablecoin market toward control of wallets, brokerages, payments, and yield entry points. U.S. stablecoin regulation is still waiting for a clearer implementation framework, and different routes including Visa, Robinhood, Circle, and Ripple are all competing for distribution rights. Capital is flowing more selectively toward U.S. dollar assets with clear use cases and yield entry points.
3.3 The LST sector pulled back broadly, while ETH staking assets were relatively resilient
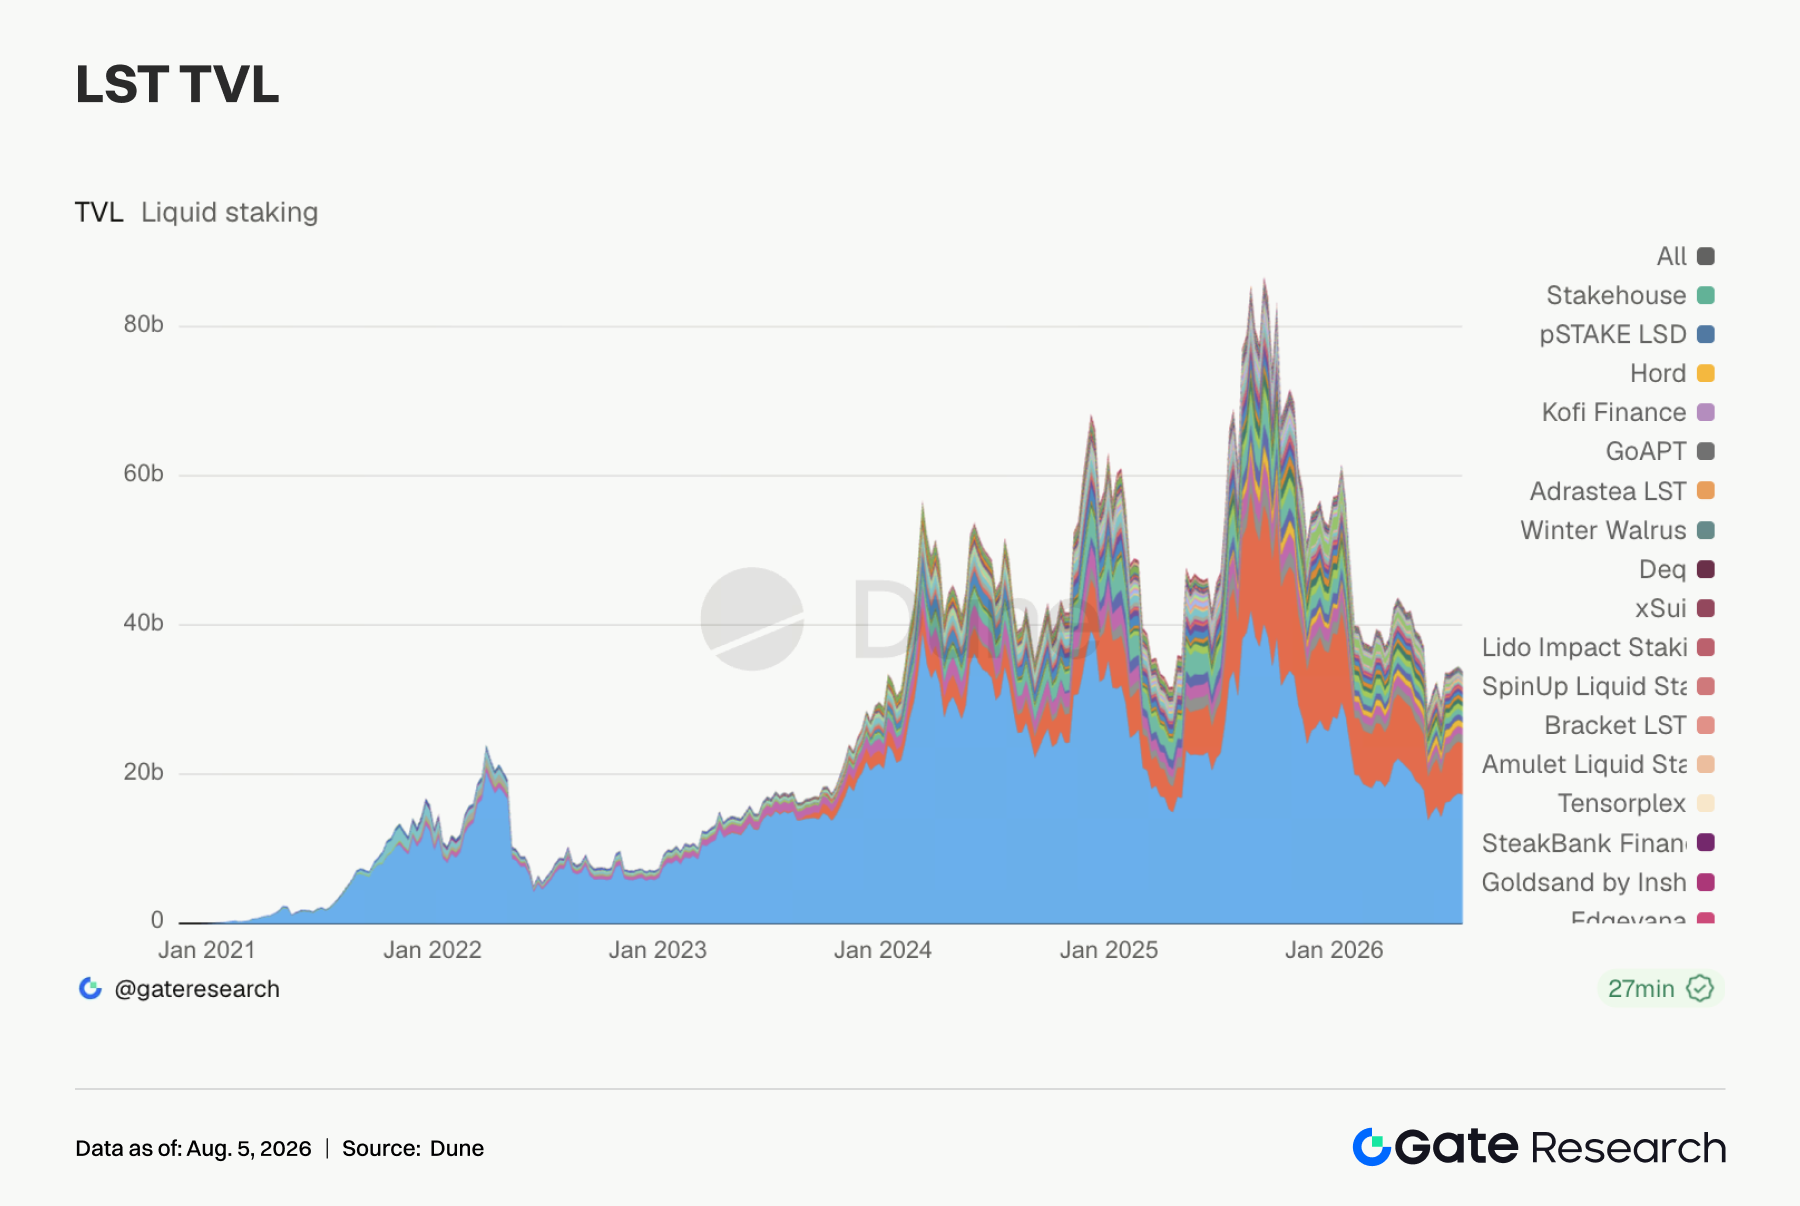
This week, the LST sector pulled back overall. Lido TVL fell from about USD 17.5 billion to USD 17.36 billion, while Rocket Pool, StakeWise, Liquid Collective, and mETH Protocol also declined slightly. Although ETH ETFs still maintained net inflows, the scale of inflows slowed compared with the previous week: from July 27 to July 31, ETH ETFs recorded total net inflows of about USD 27.4 million, clearly lower than about USD 104 million in the previous week, and the valuation repair momentum of staking assets weakened in sync. The pullback was more obvious on the SOL side, where Sanctum, Jito, Jupiter Staked SOL, and Binance Staked SOL all declined, while HYPE-related Kinetiq kHYPE and stHYPE fell even more. Against the backdrop of the FOMC, large technology earnings, and ETF flow volatility, institutional capital tended to reduce exposure to high-beta staking assets.
3.4 Aave lending was underpinned by Ethereum, Plasma, and Monad, while divergence among emerging chains deepened
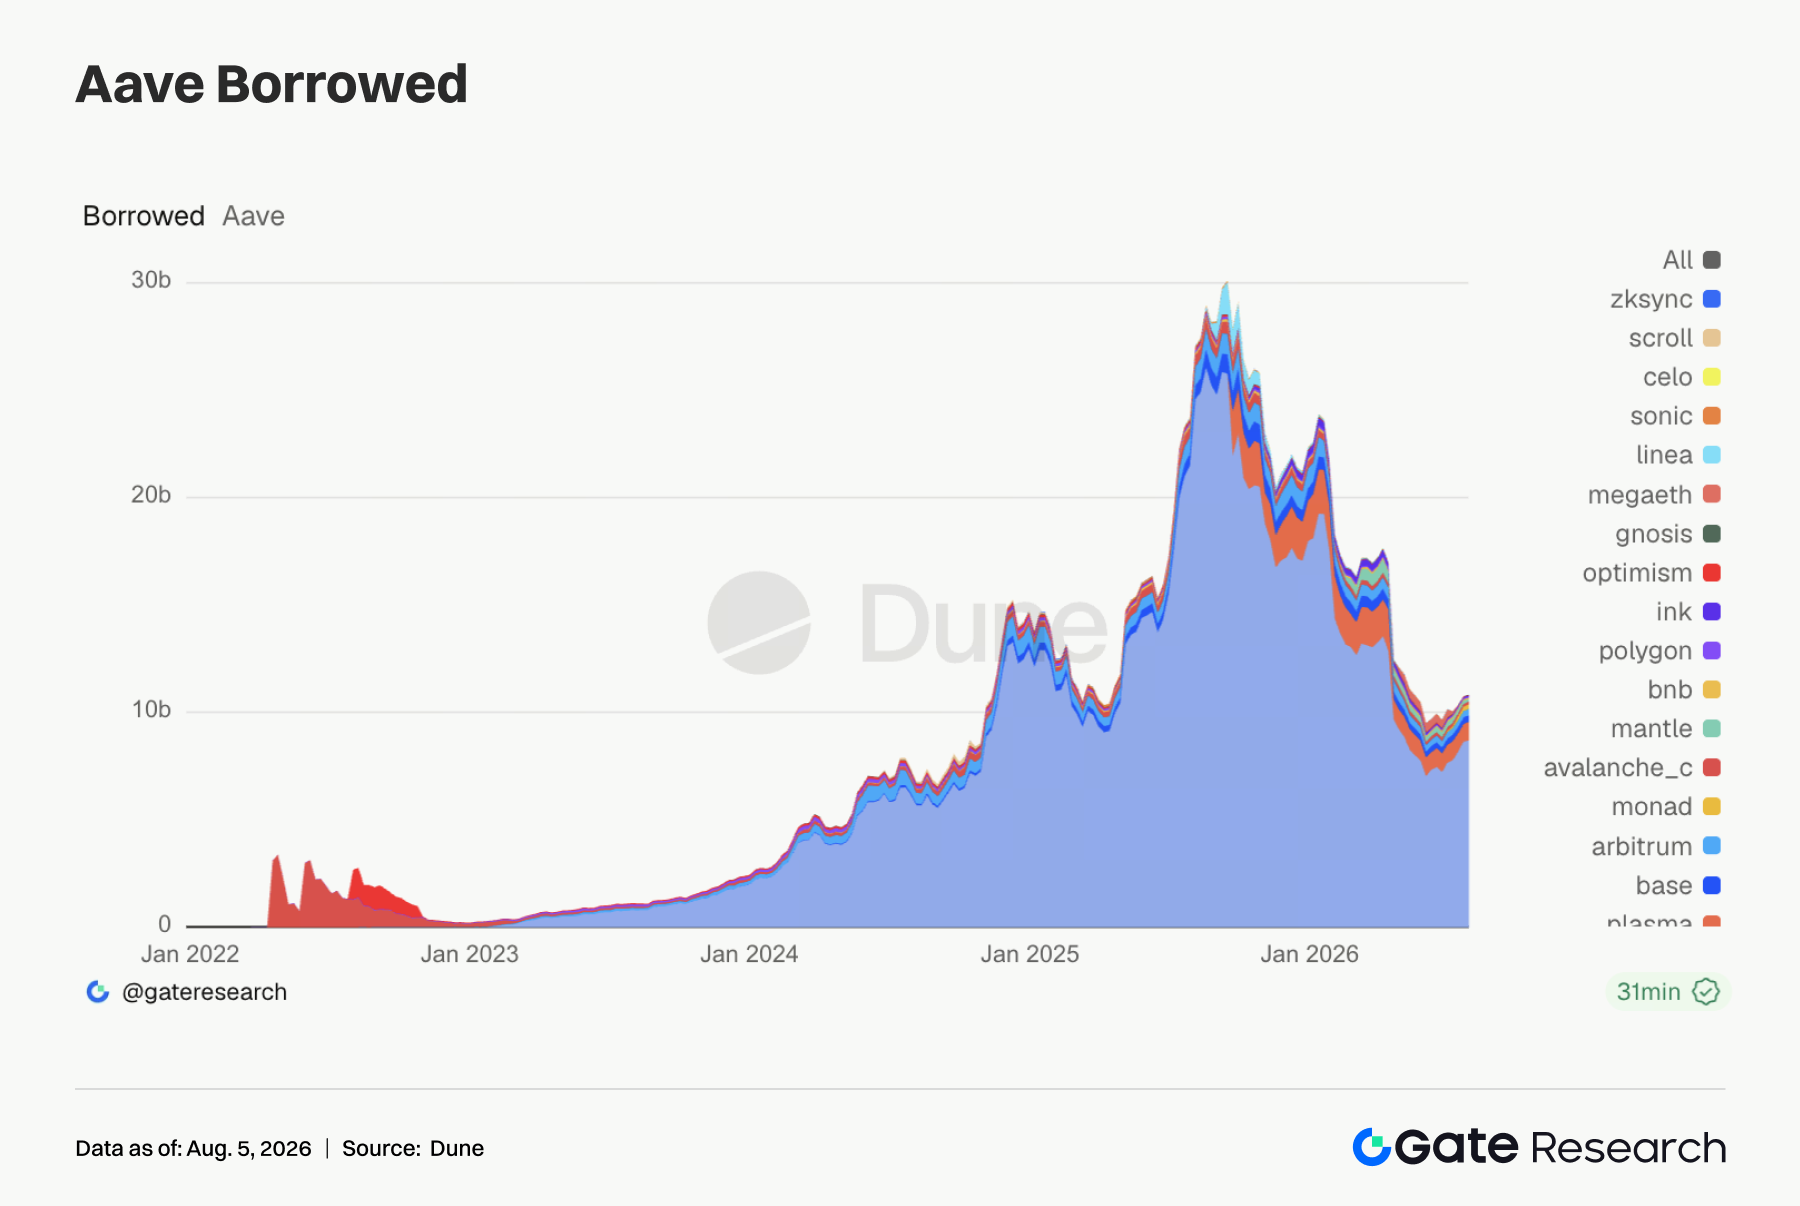
Aave borrowing balances were supported by core markets, with borrowing scale in the Ethereum market rising to about USD 8.7 billion, making it the protocol's most important liquidity pool. Plasma rose from about USD 817 million to USD 870 million, and Monad rose from about USD 192 million to USD 215 million, showing that some new chains can attract borrowing demand through incentives, early liquidity expectations, and high-yield strategies. Base was basically flat and Arbitrum declined slightly, while Mantle fell from about USD 149 million to USD 106 million and MegaETH continued to pull back. The market is re-screening emerging chains: markets with clear growth narratives and capital entry points can still expand, while markets lacking sustained incentives or trading demand are seeing positions cut.
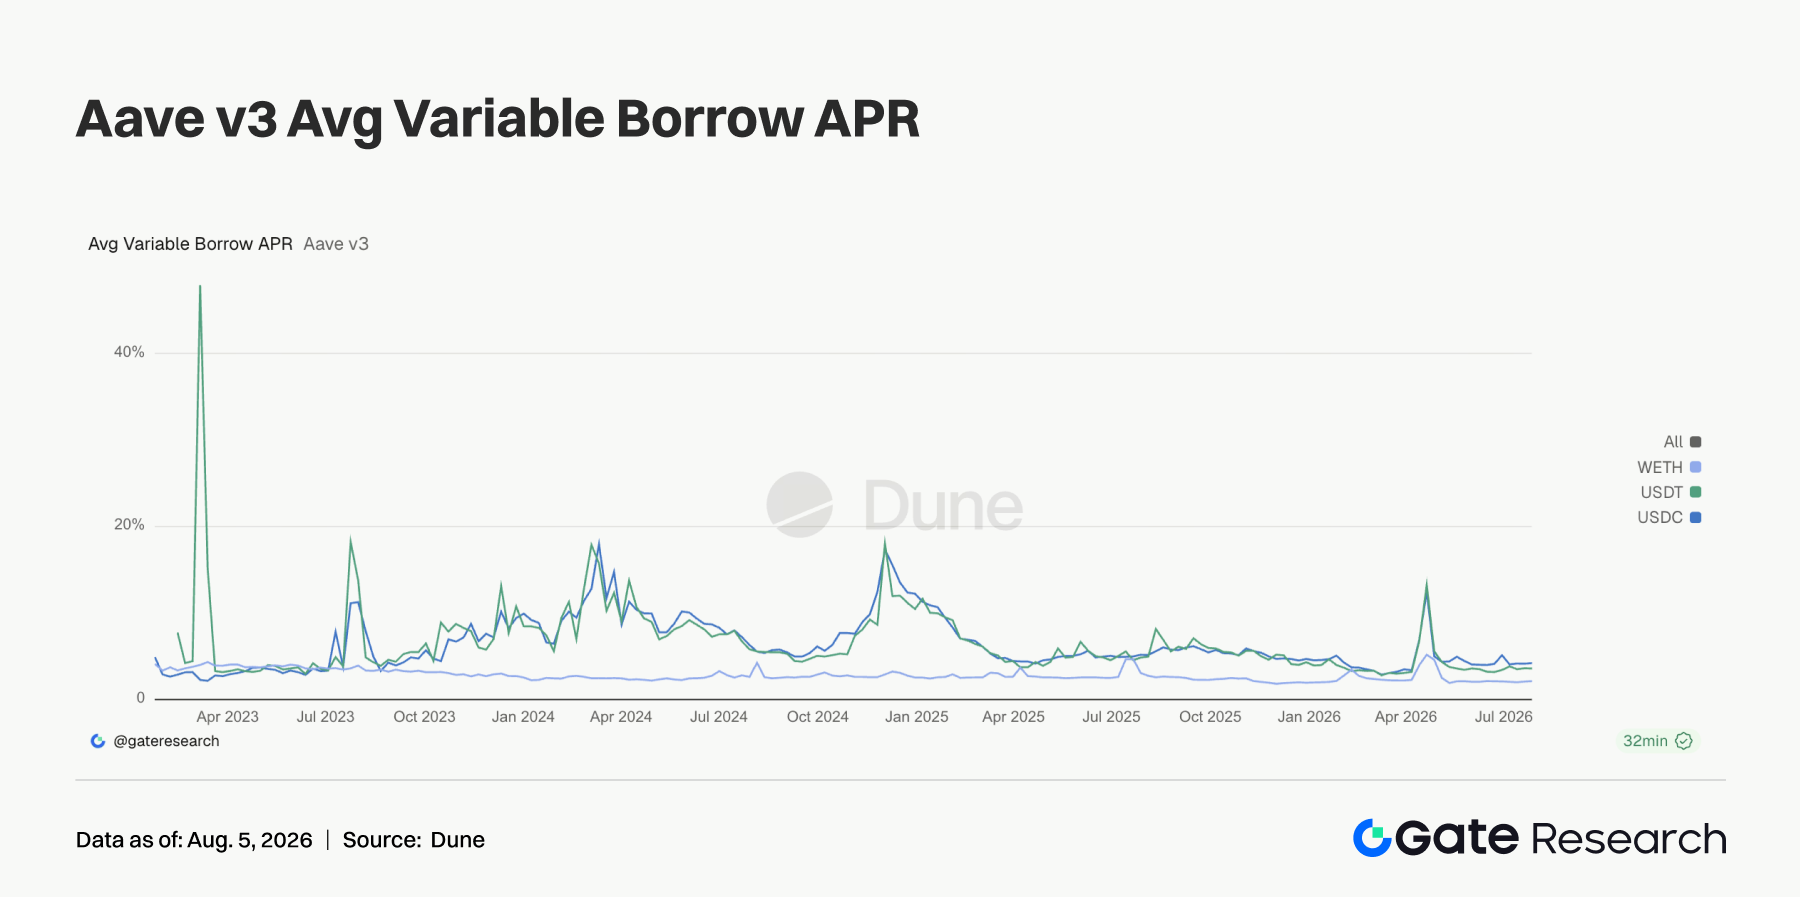
This week, rates in Aave's Ethereum main market were generally stable. The average borrowing rate for USDC was about 4.24%, slightly higher than the previous week, while the peak rate during the week approached 14%, showing that USDC can still experience short-term funding tightness when hot trading is concentrated. The average rate for USDT was about 3.61%, slightly lower than the previous week, and tail-end pressure was clearly milder. The average rate for WETH rose to about 2.15%, but remained at a low level. Growth in borrowing balances did not bring a rapid spike in financing costs, and the market was not engaged in one-way high-leverage chasing. Instead, capital rotated over short cycles among ETFs, RWA, Memes, and TradFi perpetuals. The signal from the rate side was more restrained than turnover, meaning that risk appetite recovered, but leverage remained under control.
3.6 Protocol revenue was driven by Memes and trading tools, while stablecoin issuance remained the base
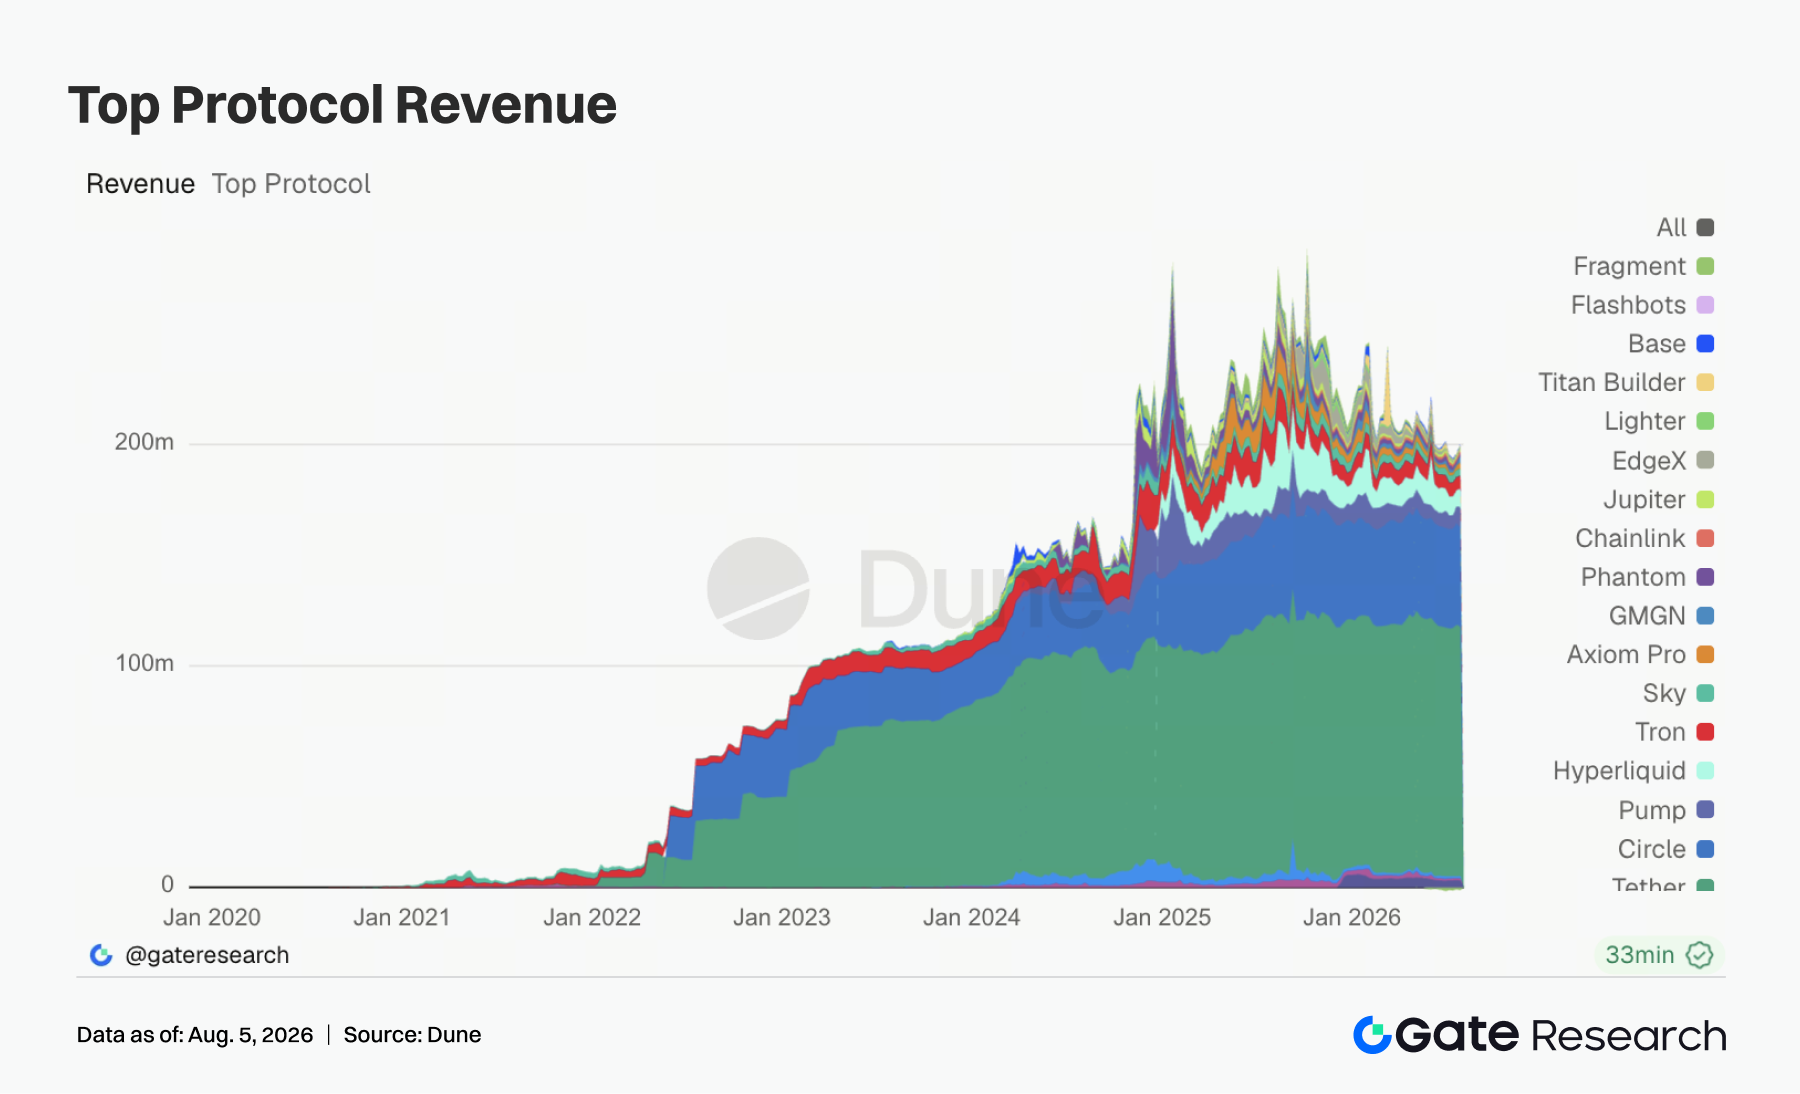
This week, the protocol revenue structure diverged. Tether and Circle recorded revenue of about USD 113 million and USD 44.77 million, respectively, serving as the industry's revenue base, though both were slightly lower than the previous week. Pump revenue rose to about USD 9.23 million and continued to exceed Hyperliquid, mutually confirming the rebound in PumpSwap turnover and Pump.fun trading activity. Hyperliquid revenue rose to about USD 8.34 million, but the growth was weaker than turnover growth in on-chain TradFi perpetuals, showing that expansion in platform trading volume does not fully translate into protocol revenue elasticity. Revenue at Axiom Pro and GMGN rose sharply, reflecting that short-term trading tools, Meme discovery, and high-frequency wallet entry points benefited again. Lighter, EdgeX, Aerodrome, and Aave also improved, while Base and Titan Builder rebounded slightly.
4. Derivatives Tracking
4.1 BTC funding rates remained positive while prices pulled back, and OI fell after surging, showing leverage chasing cooled
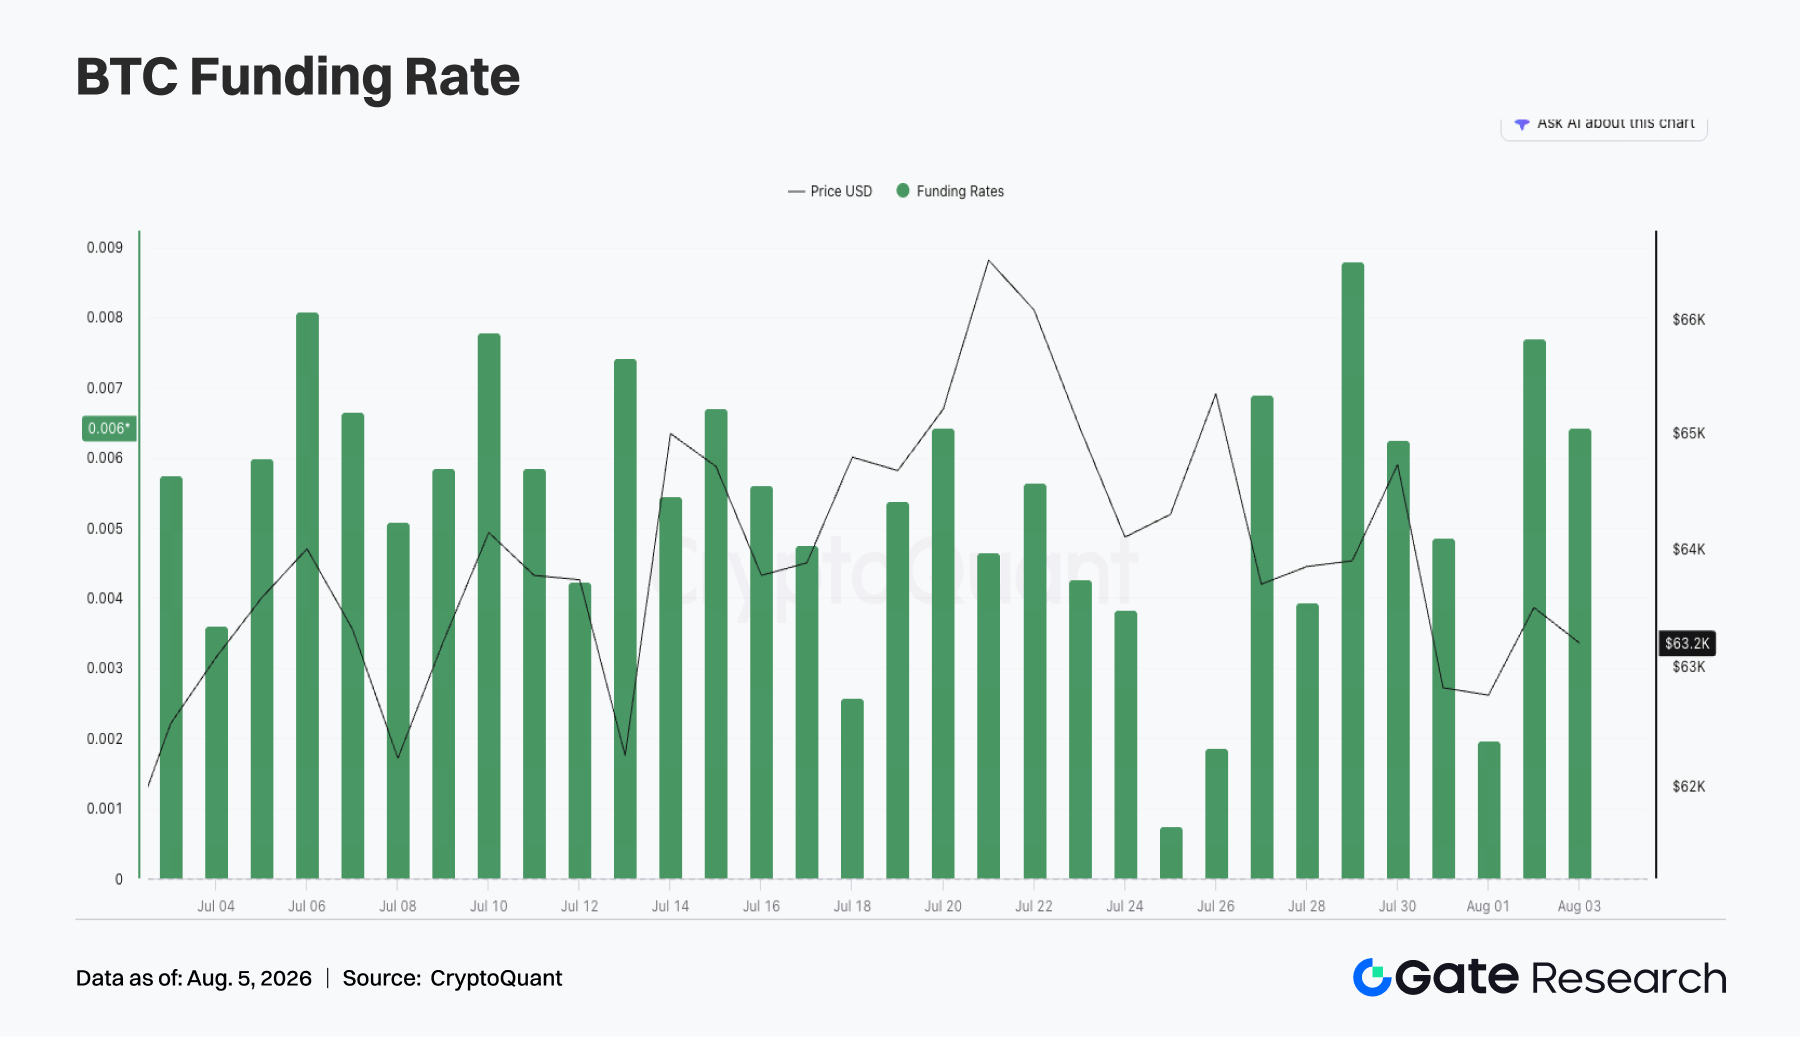
Over the past week, BTC prices overall showed a move of rising and then pulling back. At the beginning of the week, prices stayed around USD 64,000. Around July 29, they once rose to around USD 66,000, but then failed to continue the breakout and fell back to around USD 63,000 from July 31 to August 2. Overall, prices remained in a high-level consolidation range, but upward momentum weakened compared with the previous week. At the same time, OI showed a clear pattern of surging and then pulling back. Around July 27, OI was about USD 22.0 billion, then rose above USD 22.5 billion around July 29 and continued to stay high around July 30. But as prices pulled back, OI also gradually fell to around USD 22.0 billion, showing that some leveraged positions that had participated in the breakout trade began to exit.
Funding rates remained positive throughout the week, staying in the 0.003 to 0.007 range most of the time, and once rose to a relatively high level for the week around July 29, showing that bullish sentiment still held the advantage. It is worth noting that funding rates did not turn negative during the price pullback, indicating that the market did not form a crowded short structure and instead still maintained a certain amount of long positioning.
Taken together, the BTC derivatives market this week showed a combination of 'price rises and then pulls back + OI falls back from high levels + funding rates remain positive.' Bulls still dominated, but the willingness to chase higher with leverage cooled somewhat. If BTC later regains USD 65,000, OI may rise again; if prices fall below USD 63,000, attention should be paid to the retracement pressure on long positions under a positive funding-rate environment.
4.2 Options volume was high first and then low, while monthly contracts remained the core trading vehicle
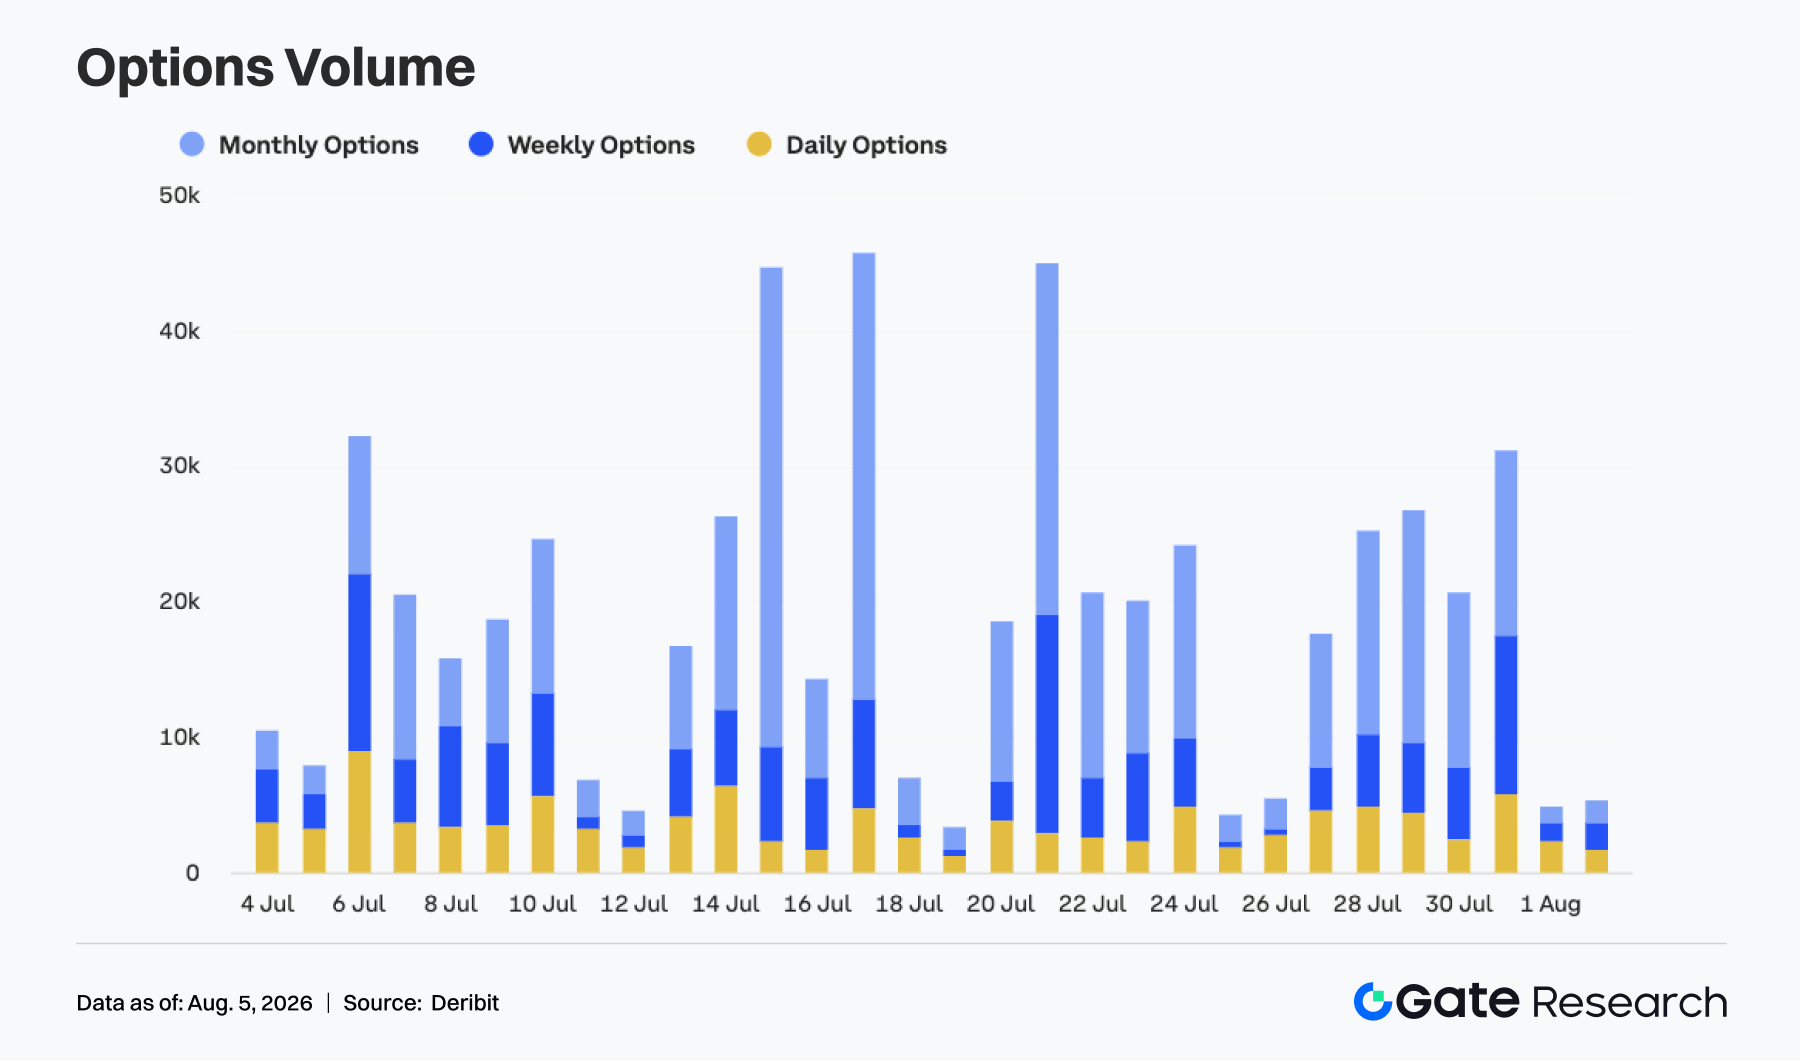
The options market as a whole showed a pattern of rising first and then falling last week. From July 28 to July 31, BTC options volume gradually expanded, with volume rising to about 31,000 contracts on July 31, the high of the week. After entering August, volume quickly fell back, dropping to around 5,000 contracts from August 1 to August 2. Structurally, monthly options still contributed the main volume, especially during the expansion phase from July 29 to July 31, when the share of monthly contracts was clearly higher, showing that market participants mainly used medium-term contracts for position adjustment and risk management. Weekly options maintained a certain level of activity on some trading days, but did not show sustained volume expansion. Daily options volume was limited overall, showing that the market did not shift on a large scale toward ultra-short-cycle speculation. The rapid pullback in volume over the weekend also indicates that this round of expansion was more related to month-end position rolling and risk management after prices rose, rather than sustained panic hedging.
Overall, the options market this week still showed a structure of 'monthly contracts dominate + volume expansion during phased position rotation.' If BTC later breaks above USD 65,000, directional trading may drive options volume higher again. If prices continue to fluctuate in the USD 63,000 to USD 65,000 range, volume may remain low.
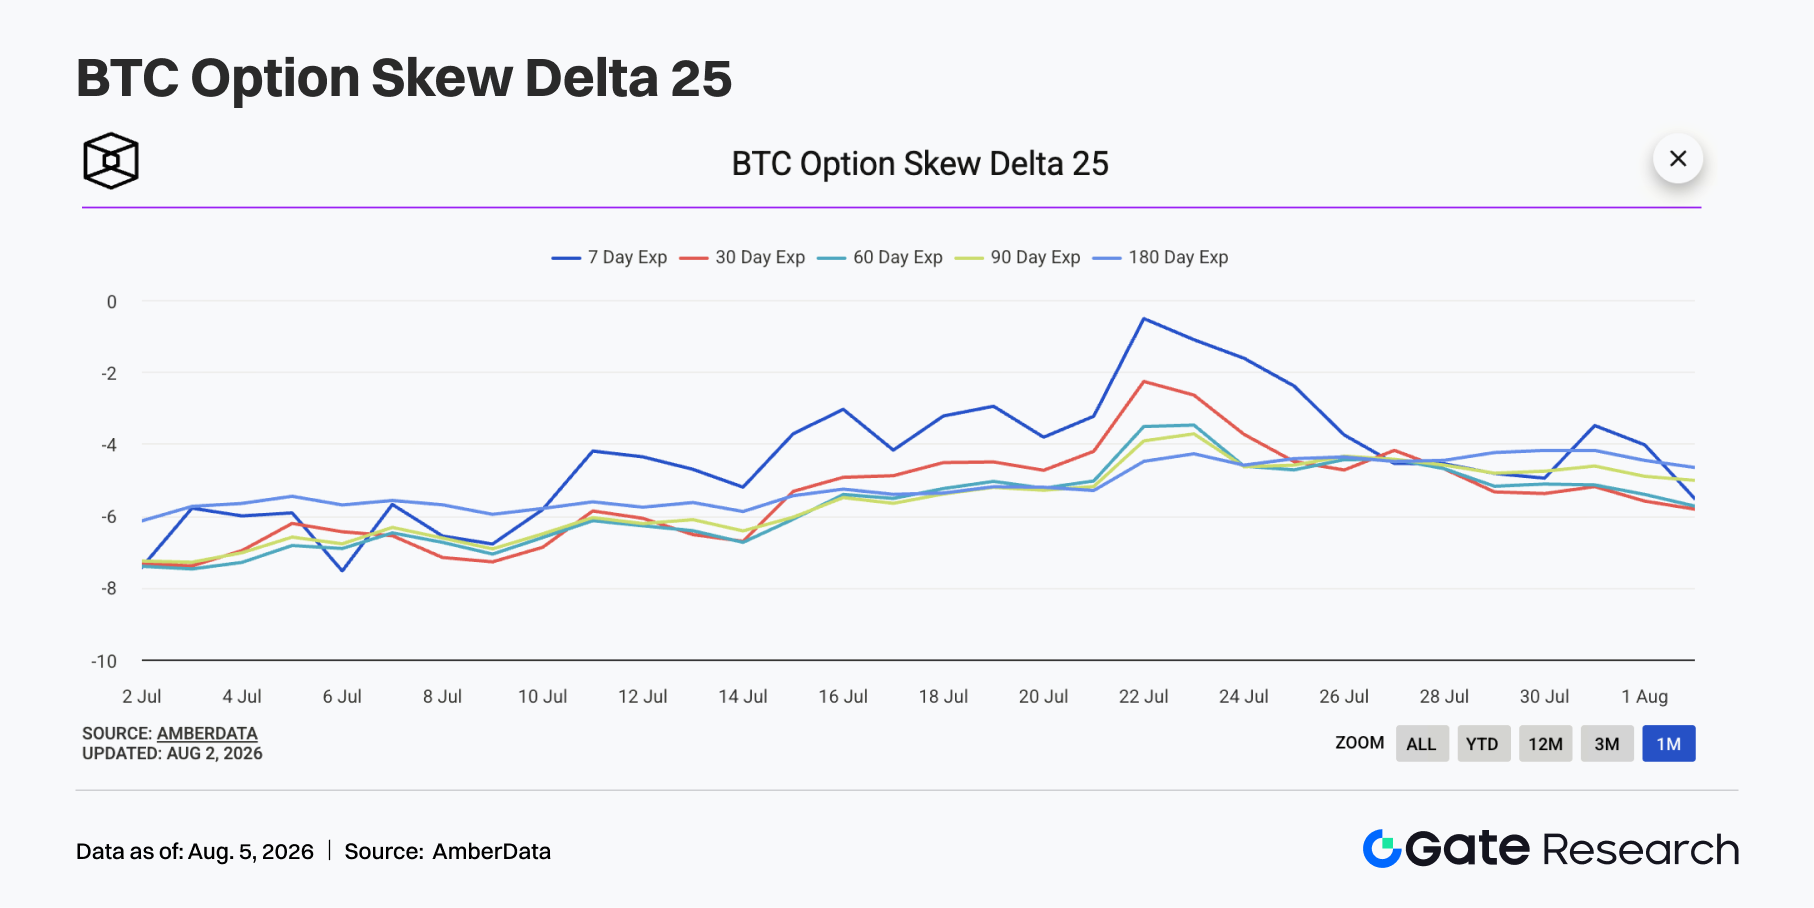
4.3 25D Skew fell back from high levels, and protective demand rebounded somewhat
From the perspective of 25D Skew, BTC Skew across maturities repaired first and then fell back last week. At the beginning of the week, Skew across maturities mostly stayed around -4 to -5, a relatively mild level in the recent period, showing that the earlier defensive sentiment had clearly eased. Around July 29, 7D Skew once approached the neutral range, indicating that the premium for short-dated downside protection fell sharply and market concern about a sudden short-term drop weakened significantly for a time. But as BTC prices pulled back from high levels, short-dated Skew moved lower again to around -5 at the beginning of August, showing that protective demand recovered somewhat. Medium- and long-dated Skew also remained negative, mostly in the -4 to -6 range, indicating that although the market had not re-entered an extremely defensive state, it still retained a certain downside risk premium. The term structure was relatively compressed overall, showing that the difference between short-term and medium-term risk pricing was not large.
Overall, the Skew structure this week reflected a marginal cooling in market risk appetite. If BTC can hold USD 63,000 and repair again, Skew is expected to continue to stay mildly negative. If prices break further below that area, short-dated protective demand may rise again.
4.4 DVOL continued to fall back, and volatility pricing compressed further
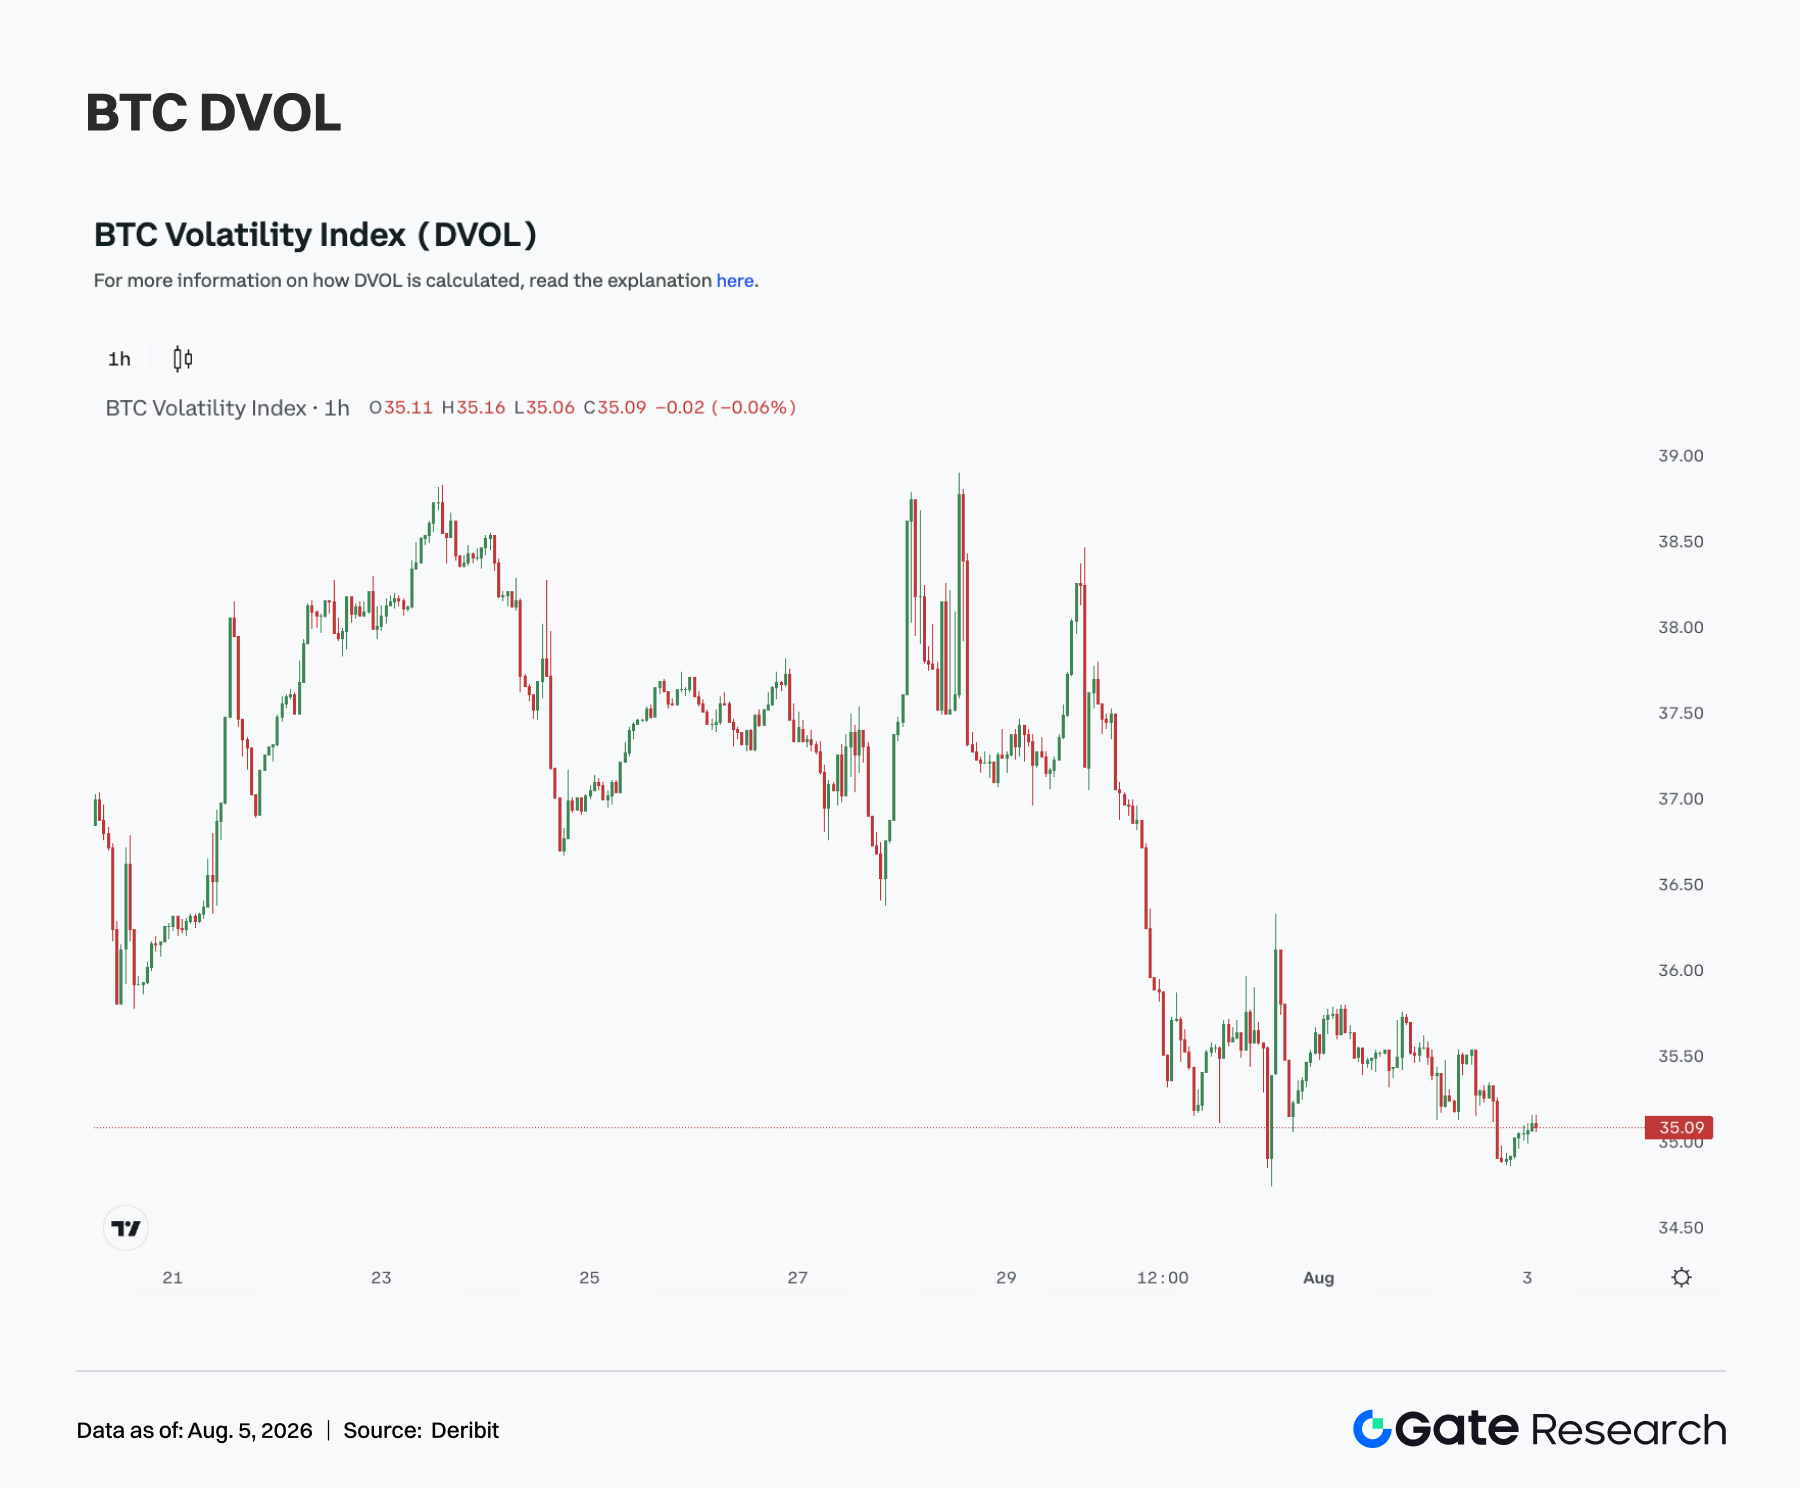
In terms of volatility, the BTC volatility index DVOL overall continued its downward trend last week. At the beginning of the week, DVOL was still around 38, then gradually fell to around 35 as price fluctuations converged and options volume pulled back, setting a recent low. This decline showed that the market's pricing of future sharp volatility continued to decrease. Although BTC rose and then pulled back during the week, price movement overall remained limited to the USD 63,000 to USD 66,000 range and did not trigger obvious panic-driven volatility expansion. The decline in DVOL mutually confirmed the pullback in OI from high levels and the mildly negative Skew, showing that the derivatives market's pricing of risk became more restrained. The market is currently more inclined to price high-level consolidation rather than a one-way breakout or a rapid decline.
Overall, BTC is currently in a combined state of 'high-level price consolidation + low DVOL + mildly negative Skew.' If prices continue to move sideways, volatility may remain low. But with DVOL already clearly compressed, once BTC breaks above USD 66,000 or falls below USD 63,000, volatility has room to rebound quickly.
5. Outlook for This Week
Data Sources:
- Investing, https://investing.com/currencies/xau-usd-historical-data
- Gate, https://www.gate.com/trade/BTC_USDT
- CMC, https://coinmarketcap.com/real-world-assets/?type=all-tokens
- Coinglass, https://www.coinglass.com/pro/depth-delta
- Dune, https://dune.com/gateresearch/gate-tradfi#weekly-volume
- Dune, https://dune.com/gateresearch/gate-institutional-weekly-report
- Bybit, https://www.bybit.com/future-activity/en/tradfi
- Bitget, https://www.bitgettradfi.com/tradfi/XAUUSD
- CryptoQuant, https://cryptoquant.com/asset/btc/chart/derivatives
- Amberdata, https://pro.amberdata.io/options/deribit/btc/current/
Gate Research is a comprehensive blockchain and cryptocurrency research platform that provides deep content for readers, including technical analysis, market insights, industry research, trend forecasting, and macroeconomic policy analysis.
Disclaimer
Investing in cryptocurrency markets involves high risk. Users are advised to conduct their own research and fully understand the nature of the assets and products before making any investment decisions. Gate is not responsible for any losses or damages arising from such decisions.