


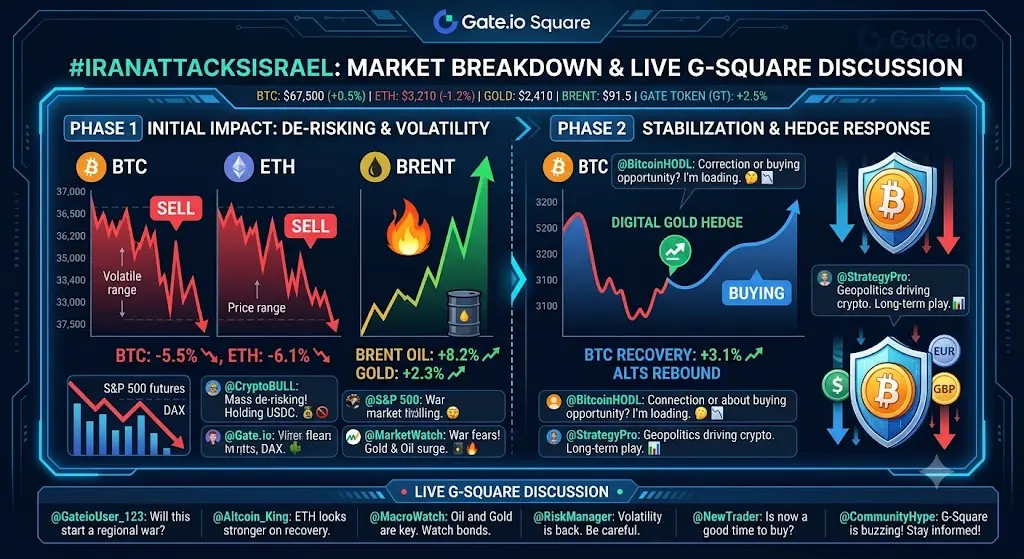


#Strategy低位加仓1550枚BTC Iran's "Ceasefire" announcement causes a sharp rebound in global risk assets. Bitcoin made a desperate comeback after touching the $59k level, regaining the $63k mark; Ethereum re-entered above $1,700, with a 24-hour increase of over 4%. Shorts were caught off guard, with over $570 million liquidated in the past 24 hours, of which more than 80% were short positions. However, the rebound is not smooth sailing—this Wednesday, the US May CPI data will be released, the last rate cut window of the year is closing, and Middle East tensions could shift again at any time. How far can this short squeeze driven by geopolitical factors go?
一、Middle East ceasefire: from 59K desperate counterattack to 63K in 24 hours
Over the past weekend, the crypto market staged a thrilling "V-shaped reversal." Earlier in the week, unexpectedly weak non-farm payroll data caused rate cut expectations to collapse instantly, leading to heavy sell-offs in both US stocks and crypto markets. Bitcoin briefly fell below the psychological $60k level, hitting a low of $59,101, the lowest in nearly three months; Ethereum also plunged, approaching $1,580.
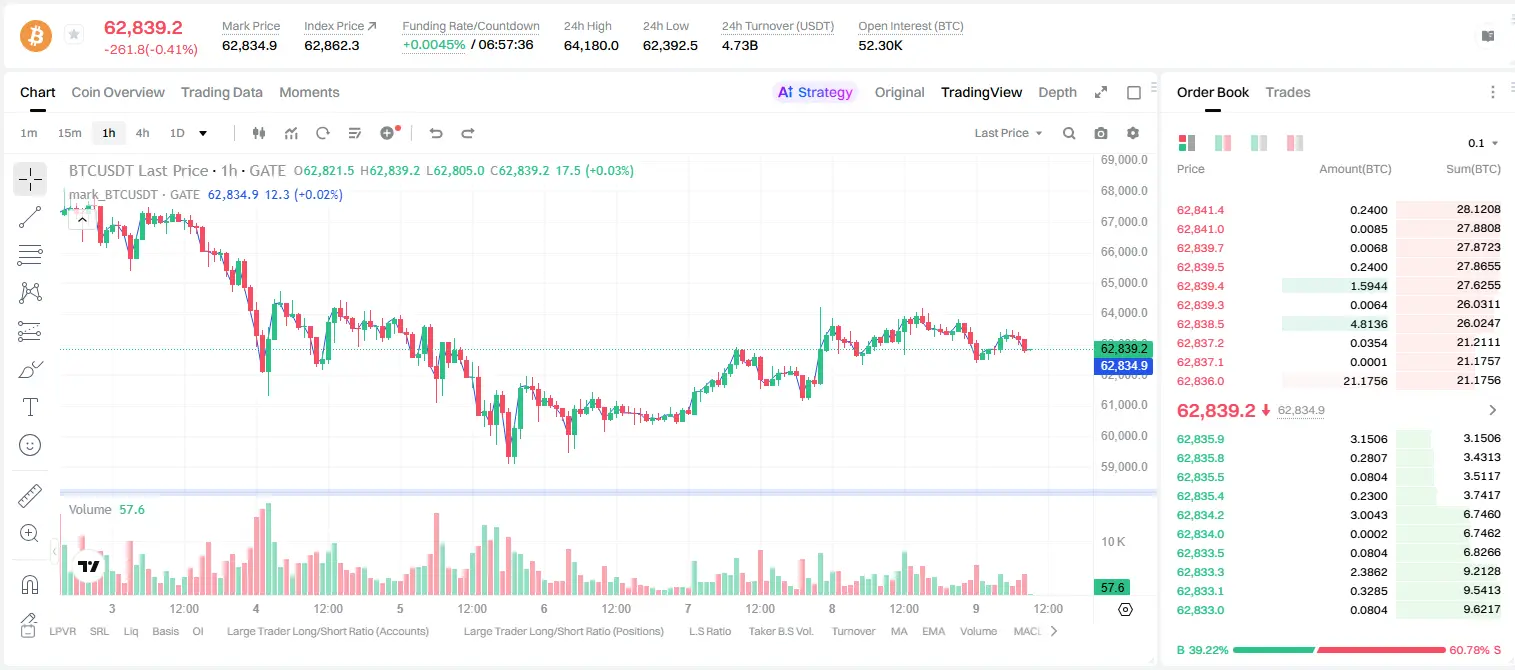
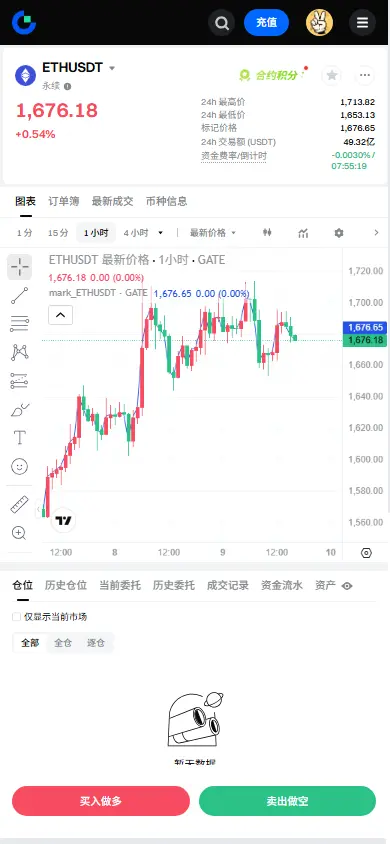
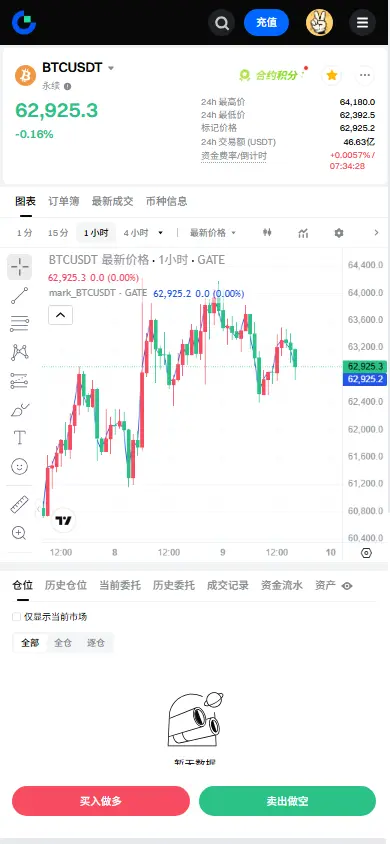
Just as panic spread, a dramatic shift occurred in geopolitical tensions. Iran and Israel agreed to temporarily halt hostilities—according to multiple reports, military confrontations in the Strait of Hormuz and Lebanon have eased temporarily. International oil prices surged then retreated, with WTI crude dropping about 1% to $91.29 per barrel, and Brent crude briefly spiking before falling back near $94. The decline in oil prices directly contributed to risk appetite recovery. Cryptocurrency markets responded with a rebound, Bitcoin retook the $63,000 level, and popular coins followed suit. Data shows BTC once surged past $64,000 intraday, up nearly 4% from the daily low. ETH rebounded from $1,580 to above $1,700, with a 24-hour high of nearly 4.5%.
On the technical side, Bitcoin's weekly chart shows a rare "bullish divergence" signal. According to Coinglass data, the last time this signal appeared was at the end of 2022, after which Bitcoin surged from $16,000 to over $73,000. However, whether this rebound can evolve into a trend reversal remains to be seen—current prices are still below a downward trendline since the cycle high, maintaining a generally bearish market structure.
Beware of logical traps: the rebound driven by geopolitical tensions is essentially a "war premium unwinding" squeeze, not a sign of fundamental improvement. If the situation escalates again, the basis for the rebound will collapse instantly.
二、Rebound slaughter of shorts: $760 million wiped out
The most painful cost of this rebound fell on those betting on declines. Over the past 24 hours, total liquidations across the network reached about $573 million. Among them, short positions were liquidated for $463 million, accounting for over 80%, while longs only saw about $59k liquidated. Approximately 95,758 traders were forcibly liquidated.
By coin, Bitcoin short liquidations amounted to about $239 million, longs about $24.42 million; Ethereum short liquidations about $134 million, longs about $26.49 million. However, in this bloodbath of short squeeze, longs also did not escape unscathed. During the earlier sharp decline, long positions were also heavily liquidated. Currently, Bitcoin contracts total about $44.4 billion, Ethereum about $23.7 billion, with market leverage still adjusting.
Core logic: The current rebound is essentially a situation where excessive short positioning triggers a chain reaction of short covering at any marginal positive news.
三、CPI looming: Wednesday data the biggest short-term variable
Compared to the "phase-wise cooling" of Middle East tensions, the US May CPI data to be released on June 10 is the real key variable determining the short-term direction.
According to Trading Economics forecasts, the market expects the May overall CPI year-over-year to accelerate from 3.8% to 4.2%, while core CPI (excluding food and energy) is expected to rise by 2.9%. April's CPI YoY of 3.8% was the highest in nearly three years. If May's data climbs further to 4.2%, it indicates inflation is not cooling but accelerating. For the crypto market, CPI data is crucial because of its influence on interest rate paths. If a second hot CPI reading occurs, market consensus on a rate cut in 2026 will be completely eliminated, and global liquidity will tighten further, possibly pushing Bitcoin to test the mid-$60,000 range.
Moreover, the latest forecast from BNP Paribas has shifted the baseline scenario from "rate cuts" to "three rate hikes starting at the end of 2026," citing persistent inflation risks and economic pressures from US-Iran conflicts. Cleveland Fed Chair Loretta Mester also warned that if inflation continues to accelerate, "the Fed may need to resume rate hikes soon."
On June 16-17, Waller will chair the FOMC meeting for the first time as Fed Chair. Currently, the market prices a 98% probability of holding rates steady in June. The Fed's dot plot and Waller's remarks at the press conference will set the policy tone for the second half of the year. Before this meeting, CPI data will be the key variable determining the final shape of the dot plot.
Worst-case scenario: CPI accelerates to 4.2%+ → rate hikes become completely unlikely within the year → BTC falls below $60,000, testing the $59,000-$55,000 range; CPI slightly above expectations but manageable → focus shifts to the dot plot, with BTC maintaining $60,000-$65,000 range.
四、ETF and capital flow: two polarizations of "Ice and Fire"
Behind this rebound, the structural divergence in capital flows continues to intensify. On one hand, Bitcoin ETF outflows remain significant. As of the week ending June 5, net outflows from Bitcoin spot ETFs totaled about $1.72 billion, continuing a four-week streak of billion-dollar redemptions since mid-May. Last week (June 2-6), net outflows reached $129 million, with Fidelity's FBTC leading at $168 million outflow. As of June 8, 2026, Bitcoin ETF net outflows this year have totaled $2.6 billion.
On the other hand, the opposite side also warrants attention: BlackRock's IBIT saw a contrarian net inflow of $81 million last week, reaching a total net inflow of $48.65 billion since inception. BlackRock is still accumulating at the bottom, indicating that the market is not fully retreating—"BlackRock is buying, other institutions are watching." Meanwhile, Ethereum faces even more severe capital difficulties.
The US Ethereum spot ETF has been in continuous net outflows for a long time. Since 2026, the crypto ETF market has shown a clear "BTC strong, ETH weak" pattern, with Ethereum ETF capital and attention far below Bitcoin ETF. The ETH/BTC exchange rate once dropped to 0.0248, a near two-year low, and has slightly recovered to 0.0262, revealing the market's true capital preference—under risk aversion, funds are quickly flowing from Ethereum to Bitcoin.
五、On-chain divergence: miner pressure vs whale accumulation
Behind the sharp price fluctuations, on-chain data shows more complex bullish and bearish signals.
Bearish signals: Miner selling pressure persists. Data shows daily exchange inflows of 10,000 to 12,000 BTC, still high, with no clear signs of selling pressure easing. Miner profit margins have also shrunk significantly; over the past month, Bitcoin production costs are around $43,000, while spot prices have fallen from over $80,000 to near $60,000, with profit margins dropping from 98% to 47%.
Bullish signals: Hash rate decline + whale accumulation.
Bitcoin's hash rate has decreased by about 145 EH/s since May, the first such contraction in six years, as some miners shift power to AI data centers. The decline in hash rate means mining difficulty will see a significant adjustment on June 13, further lowering the unit costs for surviving miners. Meanwhile, miner holdings increased by 637 BTC in the past 7 days, indicating some miners are accumulating rather than selling.
Notably, large institutional players are taking contrarian actions. Coinb's strategy head revealed that family offices, sovereign wealth funds, and other large investors are not panicking but see Bitcoin dropping below $60,000 as a buying opportunity at a discount. Addresses related to BitMine bought 25,000 ETH early on June 9 from Krak, worth about $42.03 million, showing some long-term capital is systematically accumulating ETH at current levels.
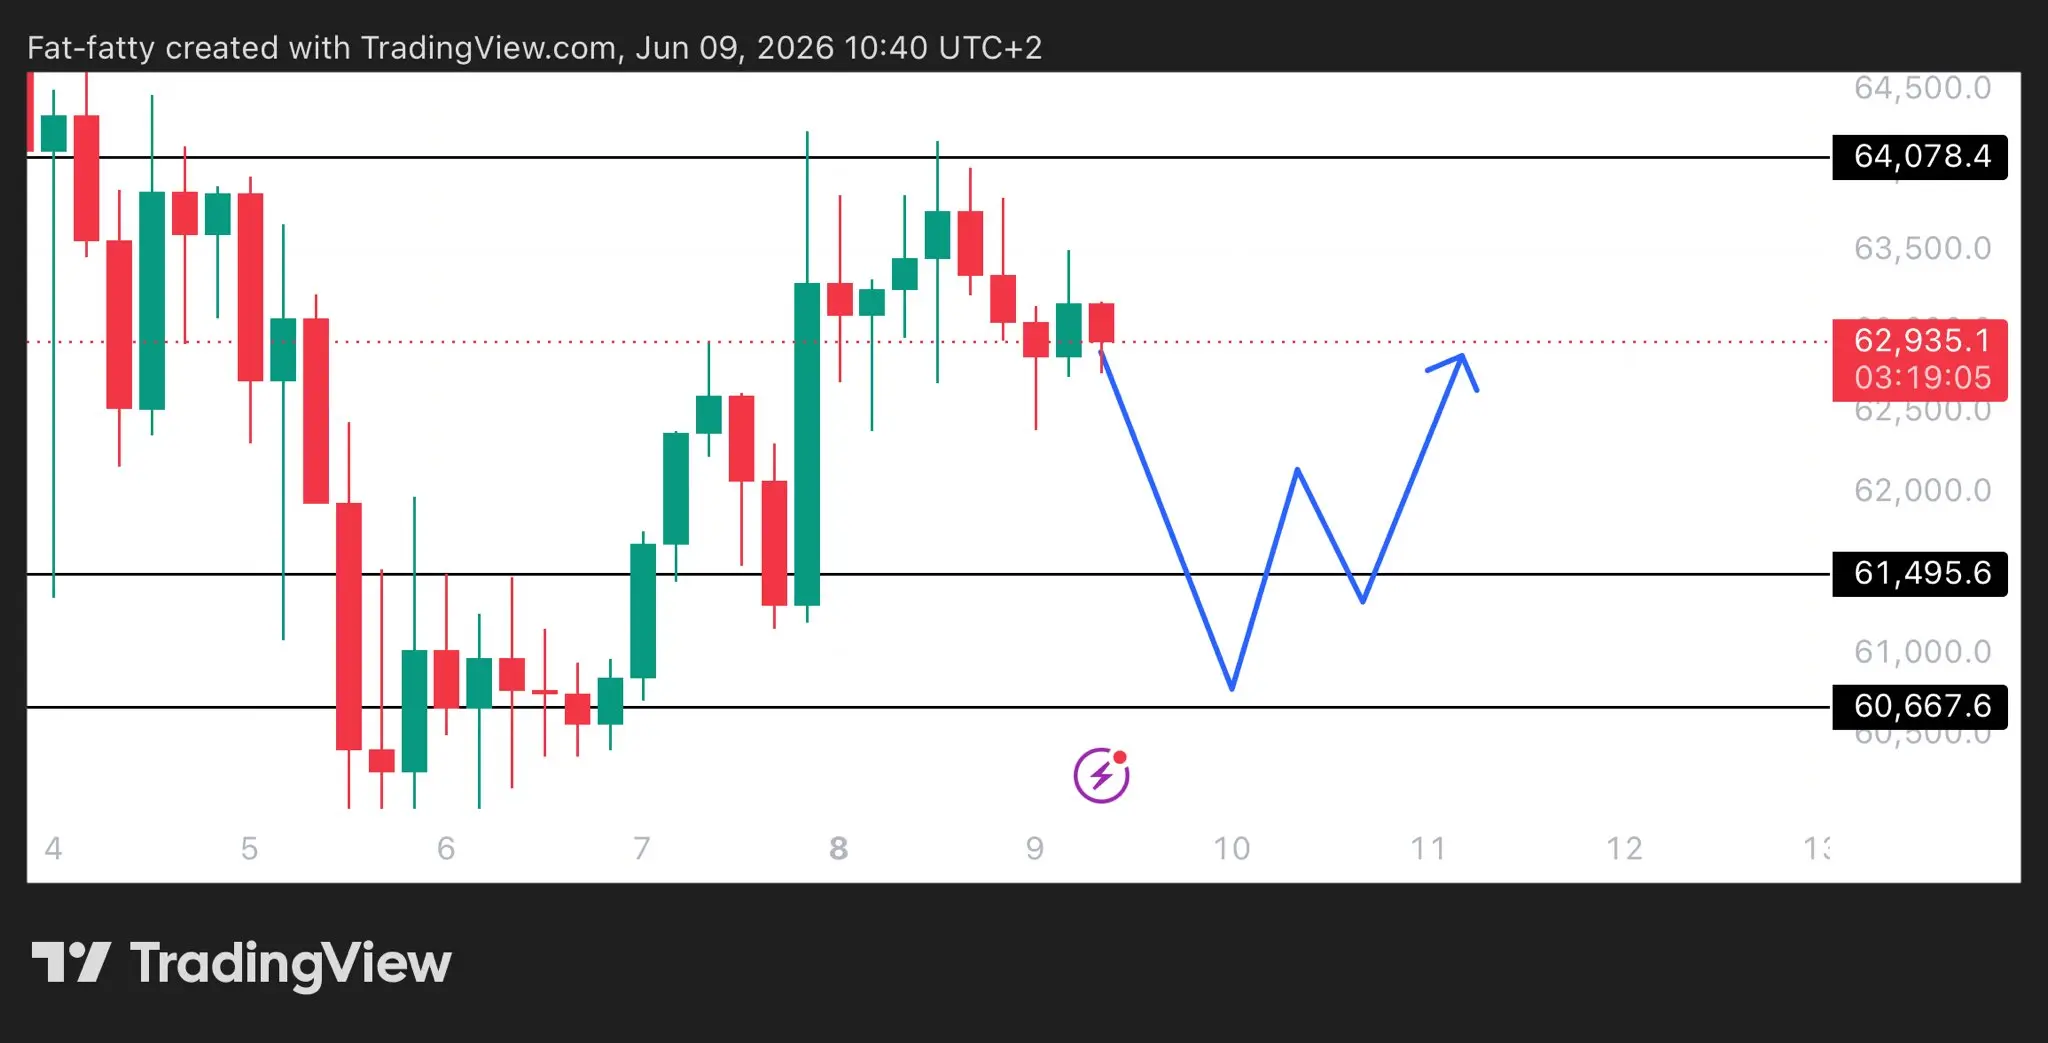
六、Key support and resistance levels for Bitcoin
Current price: approximately $63,500-$64,000
Key support: $60,000 (psychological round number, previous strong support), $59,000 (recent low, a break below opens space to $55,000-$57,000), $55,000 (deep accumulation zone)
Key resistance: $65,000 (short-term first barrier), $66,500-$67,000 (requires volume breakout to confirm rebound trend), $70,000 (bearish psychological line, needs macro catalysts to re-enter)
Technical analysis: Price remains below a downward trendline since the cycle high, maintaining a generally bearish market structure. Weekly MACD histogram has begun to rise from recent lows, indicating weakening bearish momentum but still below neutral. Aroon indicators show Aroon Up near 93%, Aroon Down around 64%, highlighting renewed buying activity near support levels, while sellers still exert influence.
Ethereum's current price: approximately $1,680-$1,710
Key support: $1,592 (long liquidation warning line, a break triggers about $995 million long liquidations), $1,500 (psychological round number), $1,380-$1,420 (next target if $1,500 fails)
Key resistance: $1,730-$1,750 (short-term bull-bear dividing line), $1,758 (break above triggers about $871 million short liquidations), $1,800 (medium-term moving average resistance zone)
Technical analysis: Ethereum has tested lows four times in four days without making new lows, indicating weakening bearish momentum. However, volume during rebounds remains weak, with insufficient buying persistence. The current market is more about "short covering" than "long buying." ETH/BTC remains near two-year lows, reflecting ongoing capital flow from Ethereum to Bitcoin. Liquidation warnings: overall market leverage remains high, with about 6-10% volatility space filled with liquidation orders below BTC and ETH. If ETH drops below $1,592, major CEXs could see $995 million in long liquidations; if it breaks above $1,758, short liquidations could reach $871 million.
七、Trading suggestions
Short-term traders: The current rebound is driven by geopolitical news, macro risks are not yet resolved. Exercise extreme caution. Before CPI data release (June 10, Beijing time evening), prefer to observe more and act less.
BTC strategy: If the rebound stalls at $65,000-$66,000, consider small short positions with strict stop-loss; do not chase longs at this level. If CPI data is hot and price volume breaks above $67,000, consider small long entries targeting $70,000.
ETH strategy: Ethereum's weak structure has not fundamentally changed. Rebound to $1,730-$1,750 is a good shorting opportunity; longs should wait for clear reversal signals in ETF capital flows for medium- and long-term accumulation. For long-term investors: macro headwinds persist, CPI data risk remains, and ETF capital has not yet reversed trend. But on-chain signals like declining miner hash rate, whale accumulation, and BlackRock IBIT inflows suggest long-term chips are intact. For long-term allocation, below $60,000 has value for phased dollar-cost averaging, but with very slow pace and small positions, avoiding heavy bets before CPI data.
Key risk warnings:
1. CPI爆雷风险 (short-term maximum variable): If May CPI YoY rises to 4.2% as expected, rate cut expectations will vanish, BTC may quickly fall below $60,000, ETH faces $1,592 liquidation risk.
2. Middle East volatility: current ceasefire is temporary; escalation will push oil prices higher, increasing inflation expectations and macro pressure.
3. ETF outflows: Bitcoin ETFs have seen four consecutive weeks of billion-dollar redemptions; if BlackRock IBIT also turns to outflows, the market could face greater blood loss.
4. Dot plot risk: If the June 16-17 FOMC meeting shifts the median dot from "two rate cuts" to "one" or "none," it will impact market sentiment. Miner selling pressure remains high, with daily inflows over 10,000 BTC, indicating structural supply pressure.
一、Middle East ceasefire: from 59K desperate counterattack to 63K in 24 hours
Over the past weekend, the crypto market staged a thrilling "V-shaped reversal." Earlier in the week, unexpectedly weak non-farm payroll data caused rate cut expectations to collapse instantly, leading to heavy sell-offs in both US stocks and crypto markets. Bitcoin briefly fell below the psychological $60k level, hitting a low of $59,101, the lowest in nearly three months; Ethereum also plunged, approaching $1,580.
Just as panic spread, a dramatic shift occurred in geopolitical tensions. Iran and Israel agreed to temporarily halt hostilities—according to multiple reports, military confrontations in the Strait of Hormuz and Lebanon have eased temporarily. International oil prices surged then retreated, with WTI crude dropping about 1% to $91.29 per barrel, and Brent crude briefly spiking before falling back near $94. The decline in oil prices directly contributed to risk appetite recovery. Cryptocurrency markets responded with a rebound, Bitcoin retook the $63,000 level, and popular coins followed suit. Data shows BTC once surged past $64,000 intraday, up nearly 4% from the daily low. ETH rebounded from $1,580 to above $1,700, with a 24-hour high of nearly 4.5%.
On the technical side, Bitcoin's weekly chart shows a rare "bullish divergence" signal. According to Coinglass data, the last time this signal appeared was at the end of 2022, after which Bitcoin surged from $16,000 to over $73,000. However, whether this rebound can evolve into a trend reversal remains to be seen—current prices are still below a downward trendline since the cycle high, maintaining a generally bearish market structure.
Beware of logical traps: the rebound driven by geopolitical tensions is essentially a "war premium unwinding" squeeze, not a sign of fundamental improvement. If the situation escalates again, the basis for the rebound will collapse instantly.
二、Rebound slaughter of shorts: $760 million wiped out
The most painful cost of this rebound fell on those betting on declines. Over the past 24 hours, total liquidations across the network reached about $573 million. Among them, short positions were liquidated for $463 million, accounting for over 80%, while longs only saw about $59k liquidated. Approximately 95,758 traders were forcibly liquidated.
By coin, Bitcoin short liquidations amounted to about $239 million, longs about $24.42 million; Ethereum short liquidations about $134 million, longs about $26.49 million. However, in this bloodbath of short squeeze, longs also did not escape unscathed. During the earlier sharp decline, long positions were also heavily liquidated. Currently, Bitcoin contracts total about $44.4 billion, Ethereum about $23.7 billion, with market leverage still adjusting.
Core logic: The current rebound is essentially a situation where excessive short positioning triggers a chain reaction of short covering at any marginal positive news.
三、CPI looming: Wednesday data the biggest short-term variable
Compared to the "phase-wise cooling" of Middle East tensions, the US May CPI data to be released on June 10 is the real key variable determining the short-term direction.
According to Trading Economics forecasts, the market expects the May overall CPI year-over-year to accelerate from 3.8% to 4.2%, while core CPI (excluding food and energy) is expected to rise by 2.9%. April's CPI YoY of 3.8% was the highest in nearly three years. If May's data climbs further to 4.2%, it indicates inflation is not cooling but accelerating. For the crypto market, CPI data is crucial because of its influence on interest rate paths. If a second hot CPI reading occurs, market consensus on a rate cut in 2026 will be completely eliminated, and global liquidity will tighten further, possibly pushing Bitcoin to test the mid-$60,000 range.
Moreover, the latest forecast from BNP Paribas has shifted the baseline scenario from "rate cuts" to "three rate hikes starting at the end of 2026," citing persistent inflation risks and economic pressures from US-Iran conflicts. Cleveland Fed Chair Loretta Mester also warned that if inflation continues to accelerate, "the Fed may need to resume rate hikes soon."
On June 16-17, Waller will chair the FOMC meeting for the first time as Fed Chair. Currently, the market prices a 98% probability of holding rates steady in June. The Fed's dot plot and Waller's remarks at the press conference will set the policy tone for the second half of the year. Before this meeting, CPI data will be the key variable determining the final shape of the dot plot.
Worst-case scenario: CPI accelerates to 4.2%+ → rate hikes become completely unlikely within the year → BTC falls below $60,000, testing the $59,000-$55,000 range; CPI slightly above expectations but manageable → focus shifts to the dot plot, with BTC maintaining $60,000-$65,000 range.
四、ETF and capital flow: two polarizations of "Ice and Fire"
Behind this rebound, the structural divergence in capital flows continues to intensify. On one hand, Bitcoin ETF outflows remain significant. As of the week ending June 5, net outflows from Bitcoin spot ETFs totaled about $1.72 billion, continuing a four-week streak of billion-dollar redemptions since mid-May. Last week (June 2-6), net outflows reached $129 million, with Fidelity's FBTC leading at $168 million outflow. As of June 8, 2026, Bitcoin ETF net outflows this year have totaled $2.6 billion.
On the other hand, the opposite side also warrants attention: BlackRock's IBIT saw a contrarian net inflow of $81 million last week, reaching a total net inflow of $48.65 billion since inception. BlackRock is still accumulating at the bottom, indicating that the market is not fully retreating—"BlackRock is buying, other institutions are watching." Meanwhile, Ethereum faces even more severe capital difficulties.
The US Ethereum spot ETF has been in continuous net outflows for a long time. Since 2026, the crypto ETF market has shown a clear "BTC strong, ETH weak" pattern, with Ethereum ETF capital and attention far below Bitcoin ETF. The ETH/BTC exchange rate once dropped to 0.0248, a near two-year low, and has slightly recovered to 0.0262, revealing the market's true capital preference—under risk aversion, funds are quickly flowing from Ethereum to Bitcoin.
五、On-chain divergence: miner pressure vs whale accumulation
Behind the sharp price fluctuations, on-chain data shows more complex bullish and bearish signals.
Bearish signals: Miner selling pressure persists. Data shows daily exchange inflows of 10,000 to 12,000 BTC, still high, with no clear signs of selling pressure easing. Miner profit margins have also shrunk significantly; over the past month, Bitcoin production costs are around $43,000, while spot prices have fallen from over $80,000 to near $60,000, with profit margins dropping from 98% to 47%.
Bullish signals: Hash rate decline + whale accumulation.
Bitcoin's hash rate has decreased by about 145 EH/s since May, the first such contraction in six years, as some miners shift power to AI data centers. The decline in hash rate means mining difficulty will see a significant adjustment on June 13, further lowering the unit costs for surviving miners. Meanwhile, miner holdings increased by 637 BTC in the past 7 days, indicating some miners are accumulating rather than selling.
Notably, large institutional players are taking contrarian actions. Coinb's strategy head revealed that family offices, sovereign wealth funds, and other large investors are not panicking but see Bitcoin dropping below $60,000 as a buying opportunity at a discount. Addresses related to BitMine bought 25,000 ETH early on June 9 from Krak, worth about $42.03 million, showing some long-term capital is systematically accumulating ETH at current levels.
六、Key support and resistance levels for Bitcoin
Current price: approximately $63,500-$64,000
Key support: $60,000 (psychological round number, previous strong support), $59,000 (recent low, a break below opens space to $55,000-$57,000), $55,000 (deep accumulation zone)
Key resistance: $65,000 (short-term first barrier), $66,500-$67,000 (requires volume breakout to confirm rebound trend), $70,000 (bearish psychological line, needs macro catalysts to re-enter)
Technical analysis: Price remains below a downward trendline since the cycle high, maintaining a generally bearish market structure. Weekly MACD histogram has begun to rise from recent lows, indicating weakening bearish momentum but still below neutral. Aroon indicators show Aroon Up near 93%, Aroon Down around 64%, highlighting renewed buying activity near support levels, while sellers still exert influence.
Ethereum's current price: approximately $1,680-$1,710
Key support: $1,592 (long liquidation warning line, a break triggers about $995 million long liquidations), $1,500 (psychological round number), $1,380-$1,420 (next target if $1,500 fails)
Key resistance: $1,730-$1,750 (short-term bull-bear dividing line), $1,758 (break above triggers about $871 million short liquidations), $1,800 (medium-term moving average resistance zone)
Technical analysis: Ethereum has tested lows four times in four days without making new lows, indicating weakening bearish momentum. However, volume during rebounds remains weak, with insufficient buying persistence. The current market is more about "short covering" than "long buying." ETH/BTC remains near two-year lows, reflecting ongoing capital flow from Ethereum to Bitcoin. Liquidation warnings: overall market leverage remains high, with about 6-10% volatility space filled with liquidation orders below BTC and ETH. If ETH drops below $1,592, major CEXs could see $995 million in long liquidations; if it breaks above $1,758, short liquidations could reach $871 million.
七、Trading suggestions
Short-term traders: The current rebound is driven by geopolitical news, macro risks are not yet resolved. Exercise extreme caution. Before CPI data release (June 10, Beijing time evening), prefer to observe more and act less.
BTC strategy: If the rebound stalls at $65,000-$66,000, consider small short positions with strict stop-loss; do not chase longs at this level. If CPI data is hot and price volume breaks above $67,000, consider small long entries targeting $70,000.
ETH strategy: Ethereum's weak structure has not fundamentally changed. Rebound to $1,730-$1,750 is a good shorting opportunity; longs should wait for clear reversal signals in ETF capital flows for medium- and long-term accumulation. For long-term investors: macro headwinds persist, CPI data risk remains, and ETF capital has not yet reversed trend. But on-chain signals like declining miner hash rate, whale accumulation, and BlackRock IBIT inflows suggest long-term chips are intact. For long-term allocation, below $60,000 has value for phased dollar-cost averaging, but with very slow pace and small positions, avoiding heavy bets before CPI data.
Key risk warnings:
1. CPI爆雷风险 (short-term maximum variable): If May CPI YoY rises to 4.2% as expected, rate cut expectations will vanish, BTC may quickly fall below $60,000, ETH faces $1,592 liquidation risk.
2. Middle East volatility: current ceasefire is temporary; escalation will push oil prices higher, increasing inflation expectations and macro pressure.
3. ETF outflows: Bitcoin ETFs have seen four consecutive weeks of billion-dollar redemptions; if BlackRock IBIT also turns to outflows, the market could face greater blood loss.
4. Dot plot risk: If the June 16-17 FOMC meeting shifts the median dot from "two rate cuts" to "one" or "none," it will impact market sentiment. Miner selling pressure remains high, with daily inflows over 10,000 BTC, indicating structural supply pressure.