For traders asking Fibonacci Retracement vs. Bollinger Bands: which is better for reversal trading?, the answer depends on the market structure. Fibonacci Retracement is often more useful for identifying where a pullback might exhaust itself in a trending market, while Bollinger Bands are stronger at showing when price has become stretched relative to its recent volatility.
For reversal traders, that difference matters. Fibonacci answers where a reversal might happen based on previous price moves. Bollinger Bands help answer whether price is relatively extended compared with its recent average. A trader may then look for confirmation from price action, volume or momentum before acting.
Key Takeaways
-
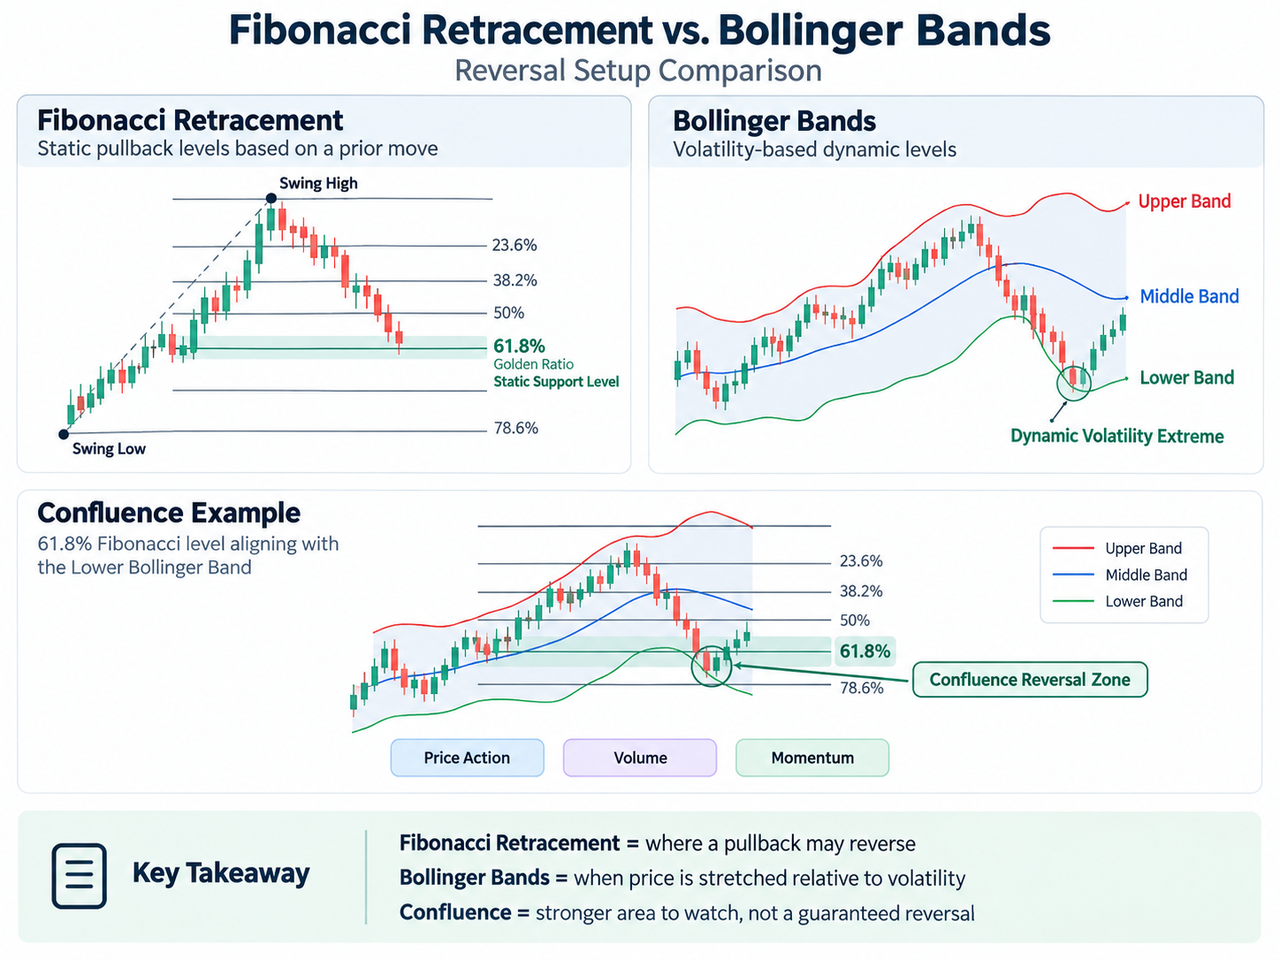
Fibonacci Retracement plots fixed horizontal lines based on percentage ratios such as 23.6%, 38.2%, 50%, 61.8% and 78.6%.
-
Fibonacci levels remain static on the chart until the trader manually redraws them for a new swing high or low.
-
Bollinger Bands consist of upper, middle and lower lines that dynamically adjust as volatility changes.
-
Fibonacci Retracement often works best in trending markets, while Bollinger Bands are particularly useful in ranging or mean-reverting conditions.
-
Combining Fibonacci Retracement and Bollinger Bands can create stronger reversal setups when both identify the same price area, but confirmation is still required.
Fibonacci Retracement vs. Bollinger Bands: The Core Difference
Fibonacci Retracement is a static technical analysis tool based on mathematical ratios. Traders manually place it between a meaningful swing high and swing low, after which it plots fixed horizontal support and resistance levels across the chart.
Common Fibonacci retracement levels include:
-
23.6%
-
38.2%
-
50%
-
61.8%
-
78.6%
The 61.8% level is commonly associated with the golden ratio. The 50% level isn't mathematically derived from the Fibonacci sequence, but it remains widely used in practical chart analysis.
Bollinger Bands work differently. They are dynamic volatility indicators calculated from a moving average and standard deviation.
A common configuration is:
Middle Band = 20-period simple moving average
Upper Band = Middle Band + (2 × standard deviation)
Lower Band = Middle Band − (2 × standard deviation)
The upper and lower bands widen when market volatility increases and contract when volatility falls.
| Feature |
Fibonacci Retracement |
Bollinger Bands |
| Main purpose |
Identify pullback and reversal levels |
Measure relative price extremes and volatility |
| Inputs |
Manually chosen swing high and low |
Price moving average and standard deviation |
| Levels |
Static |
Dynamic |
| Strongest environment |
Trending markets |
Ranging or mean-reverting markets |
| Subjectivity |
Manual swing selection |
Formula-driven once settings are chosen |
| Key weakness |
Different anchors create different levels |
Strong trends can ride an outer band |
How Fibonacci Retracement Levels Identify Pullback Exhaustion
Fibonacci Retracement focuses on finding where a pullback is likely to lose momentum relative to the previous price move.
To calculate Fibonacci retracement levels, the trader identifies a clear directional swing. The Fibonacci retracement tool then divides that move using predefined ratios. These price levels can become potential support during an uptrend or potential resistance during a downtrend.
Suppose Bitcoin rallies from a swing low to a new swing high before beginning a correction. A trader may use Fibonacci Retracement to monitor 38.2%, 50% and 61.8% as possible pullback exhaustion zones.
If price retraces toward 61.8% and then forms a bullish reversal pattern, the setup may deserve closer attention. A reversal trader might also look for confirmation from price action, increasing volume or improving momentum before entering.
Zig Zag can help simplify price movements and highlight major swings, while Fractals can mark local turning points that may help with Fibonacci placement.
Why Fibonacci Levels Are Strongest in Trending Markets
Fibonacci Retracement excels in trending markets because it needs a meaningful prior move to measure.
In a clear uptrend, traders use Fibonacci levels to estimate where a correction might stop before the prevailing trend resumes. In a downtrend, the same technique can identify potential resistance as price rebounds.
Fibonacci retracement analysis can therefore help distinguish between a routine pullback and a move that is becoming deep enough to threaten the original trend.
The tradeoff is subjectivity. Fibonacci levels require manual placement, so two traders may choose different swing highs or lows and produce different support and resistance levels from the same chart.
Once placed, however, the Fibonacci levels remain static until manually redrawn. That makes them useful for planning entries, stop-loss placement and price targets around clearly defined levels.
Widely watched Fibonacci zones can also attract significant trader and algorithmic attention, particularly around levels such as 38.2%, 50% and 61.8%. That doesn't guarantee a reaction, but it can increase market focus around those areas.
How Bollinger Bands Measure Volatility and Price Extremes
Bollinger Bands measure how far price has moved from its recent average relative to current volatility.
The middle band is a moving average of price. The upper and lower bands are typically calculated using standard deviations from that average. As volatility increases, the bands widen. As volatility falls, they narrow.
Because the calculation is formula-driven, Bollinger Bands are mathematically objective once the user selects the settings. Unlike Fibonacci Retracement, no swing high or swing low needs to be manually chosen.
Price near the upper band is relatively high compared with its recent distribution, while price near the lower band is relatively low. Traders sometimes describe these conditions as overbought or oversold, but that wording needs care.
A move above the upper Bollinger Band does not automatically mean price is overbought and about to fall. Likewise, a break below the lower band doesn't automatically mean price is oversold and ready to rise. In strong trends, price can remain near or outside an outer band for an extended period.
That is why Bollinger Bands are better viewed as indicators of relative price position and volatility rather than automatic reversal signals.
Why Bollinger Bands Excel in Range-Bound Markets
Bollinger Bands are especially useful in ranging or mean-reverting markets where price repeatedly oscillates around an average.
In those conditions, movement toward the lower band may identify an overextended decline relative to the recent range, while movement toward the upper band may identify an overextended rally.
This can help traders locate areas where mean reversion might occur.
The problem comes when market conditions shift. During a breakout or strong trend, price can “walk the band,” creating repeated false reversal signals. A trader who sells every upper-band touch or buys every lower-band touch can quickly accumulate losses.
Other technical indicators can help. ATR measures absolute volatility, while Bollinger %B shows where price sits relative to the upper and lower bands.
Fibonacci Strategy vs. Bollinger Bands Across Market Conditions
The better tool depends largely on market environment.
In a clear trend, Fibonacci Retracement is usually stronger because the strategy aims to identify where a corrective move may exhaust itself before the trend resumes.
In a sideways market, Bollinger Bands may provide better context because the bands adapt continuously to price fluctuations and volatility.
A practical framework looks like this:
-
Established trend: favor Fibonacci Retracement.
-
Range-bound or mean-reverting market: favor Bollinger Bands.
-
Strong volatility expansion: avoid assuming an outer-band break will reverse.
-
Weak or unclear swing structure: Fibonacci placement becomes more subjective.
-
Potential reversal: require confirmation from price action, momentum, volume or trend indicators.
For a live example, traders can apply both tools to the BTC/USDT spot chart on Gate.com, comparing static Fibonacci levels with Bollinger Bands as they expand and contract around current price.
Combining Fibonacci Retracement and Bollinger Bands
Many traders combine Fibonacci Retracement and Bollinger Bands because the two tools measure different aspects of the market.
Suppose an uptrend begins pulling back. The 61.8% Fibonacci retracement aligns with the lower Bollinger Band and a previous horizontal support level.
That creates a confluence area.
The Fibonacci retracement level identifies potential support based on the previous price swing. The lower Bollinger Band shows that price is also trading near a relative volatility extreme.
A reversal trader might then wait for:
OBV can help determine whether cumulative volume supports the price move, while Money Flow Index combines price and volume when evaluating momentum.
Combining Fibonacci Retracement and Bollinger Bands can improve the quality of a setup by creating confluence, but it does not mathematically guarantee a valid reversal.
Using Fibonacci Levels for Risk Management
Fibonacci levels can also support risk management after a trading opportunity has been identified.
A trader entering near a Fibonacci support zone may place a stop-loss beyond the next meaningful Fibonacci level or below the swing structure that would invalidate the setup.
For example, a long position based on support around the 61.8% retracement might be invalidated if price breaks decisively below the swing low. The trader can then define the loss level before entering rather than reacting after price moves against the position.
Fibonacci extension levels can also be used as possible price targets if the trend resumes. These targets can be compared with previous resistance zones, the upper Bollinger Band or other technical levels.
The strategy captures trading opportunities more effectively when the entry, stop-loss and take-profit logic are all defined before the trade begins.
Strategy Risks: Market Noise and False Signals
Both indicators can fail because financial markets don't have to react at technically convenient levels.
Fibonacci Retracement suffers from manual placement risk. If traders choose different swing points, they may calculate different retracement zones.
Bollinger Bands face a different problem. They respond to volatility but don't independently identify trend direction. During a strong trend, an outer-band touch can indicate momentum rather than exhaustion.
Market noise adds another difficulty. On short timeframes, price may briefly break key support and resistance before snapping back, while temporary volatility spikes can push price beyond an outer band without changing the broader structure.
Clear trading rules should therefore define:
The indicators help organize decisions. They don't remove uncertainty.
Conclusion
Fibonacci Retracement is generally more useful for identifying potential reversal points in trending markets because it maps fixed support and resistance levels from prior price moves. Bollinger Bands are better suited to identifying relative price extremes and volatility conditions, particularly in ranging or mean-reverting markets.
Fibonacci Retracement is static and manually placed. Bollinger Bands are dynamic and formula-driven.
Neither is universally superior for reversal trading. The stronger setup often appears when both indicators identify the same area and price action, volume or momentum confirms that the market is actually responding there.
Used together, they can help traders define where a reversal might occur, how stretched the current move is, and where the trading idea becomes invalid.
FAQs
What does Fibonacci Retracement tell a reversal trader?
Fibonacci Retracement identifies potential price levels where a pullback may exhaust itself based on the size of the preceding move. It is particularly useful when a clear trend and well-defined swing high and low exist.
Are Fibonacci Retracement levels static?
Yes. Once the tool is drawn between a selected high and low, the Fibonacci levels remain fixed until the trader manually moves or redraws the anchors.
What are the main Fibonacci retracement levels?
The most commonly used levels are 23.6%, 38.2%, 50%, 61.8% and 78.6%. The 61.8% level is associated with the golden ratio.
Do Bollinger Bands identify overbought and oversold conditions?
They can show when price is relatively high or low compared with its recent volatility range, but an outer-band break shouldn't be treated as an automatic overbought or oversold reversal signal. Strong trends can keep price near an outer band for extended periods.
Can Fibonacci Retracement and Bollinger Bands be used together?
Yes. A Fibonacci retracement level that aligns with an outer Bollinger Band can create a stronger area of interest for reversal analysis. Traders usually look for confirmation from price action, volume or momentum before entering.
Which is better in trending markets?
Fibonacci Retracement is often more useful in trending markets because it measures pullbacks against a clearly defined prior move. Bollinger Bands can still help by showing whether volatility is expanding and whether price is stretched relative to its recent average.
Disclaimer: This content is for educational and informational purposes only and does not constitute financial or investment advice. Technical indicators can generate false signals, and historical market behavior does not guarantee future results.