Below is an overview of the key indicators and available features for customizing candlestick charts.
Indicators and Features of Candlestick Charts
1. Candlestick Intervals
Available intervals include: 10s, 1min, 5min, 15min, 30min, 60min, 4h, 8h, 1 day, 1 week, 1 month.
For example:
A 1-week candlestick displays Monday’s opening price, Sunday’s closing price, and the highest and lowest prices recorded throughout the week.
2. Candlestick Colors and Structure
-
When the closing price is higher than the opening price, the candlestick body appears green (default).
- The highest point of the upper wick represents the highest price.
- The lowest point of the lower wick represents the lowest price.
-
When the closing price is lower than the opening price, the candlestick body appears red (default).
- The highest point of the upper wick represents the highest price.
- The lowest point of the lower wick represents the lowest price.
3. Display Modes
You can choose from Original, TradingView, and Depth modes depending on your preference.

How to Use Chart Tools and Customize the Chart
1. Change the Chart Type
Click the candle icon to select your preferred chart type.

2. Use the Drawing Toolbar
The Drawing Toolbar allows you to annotate or highlight areas on the chart.
You can hide the toolbar when it’s not in use.
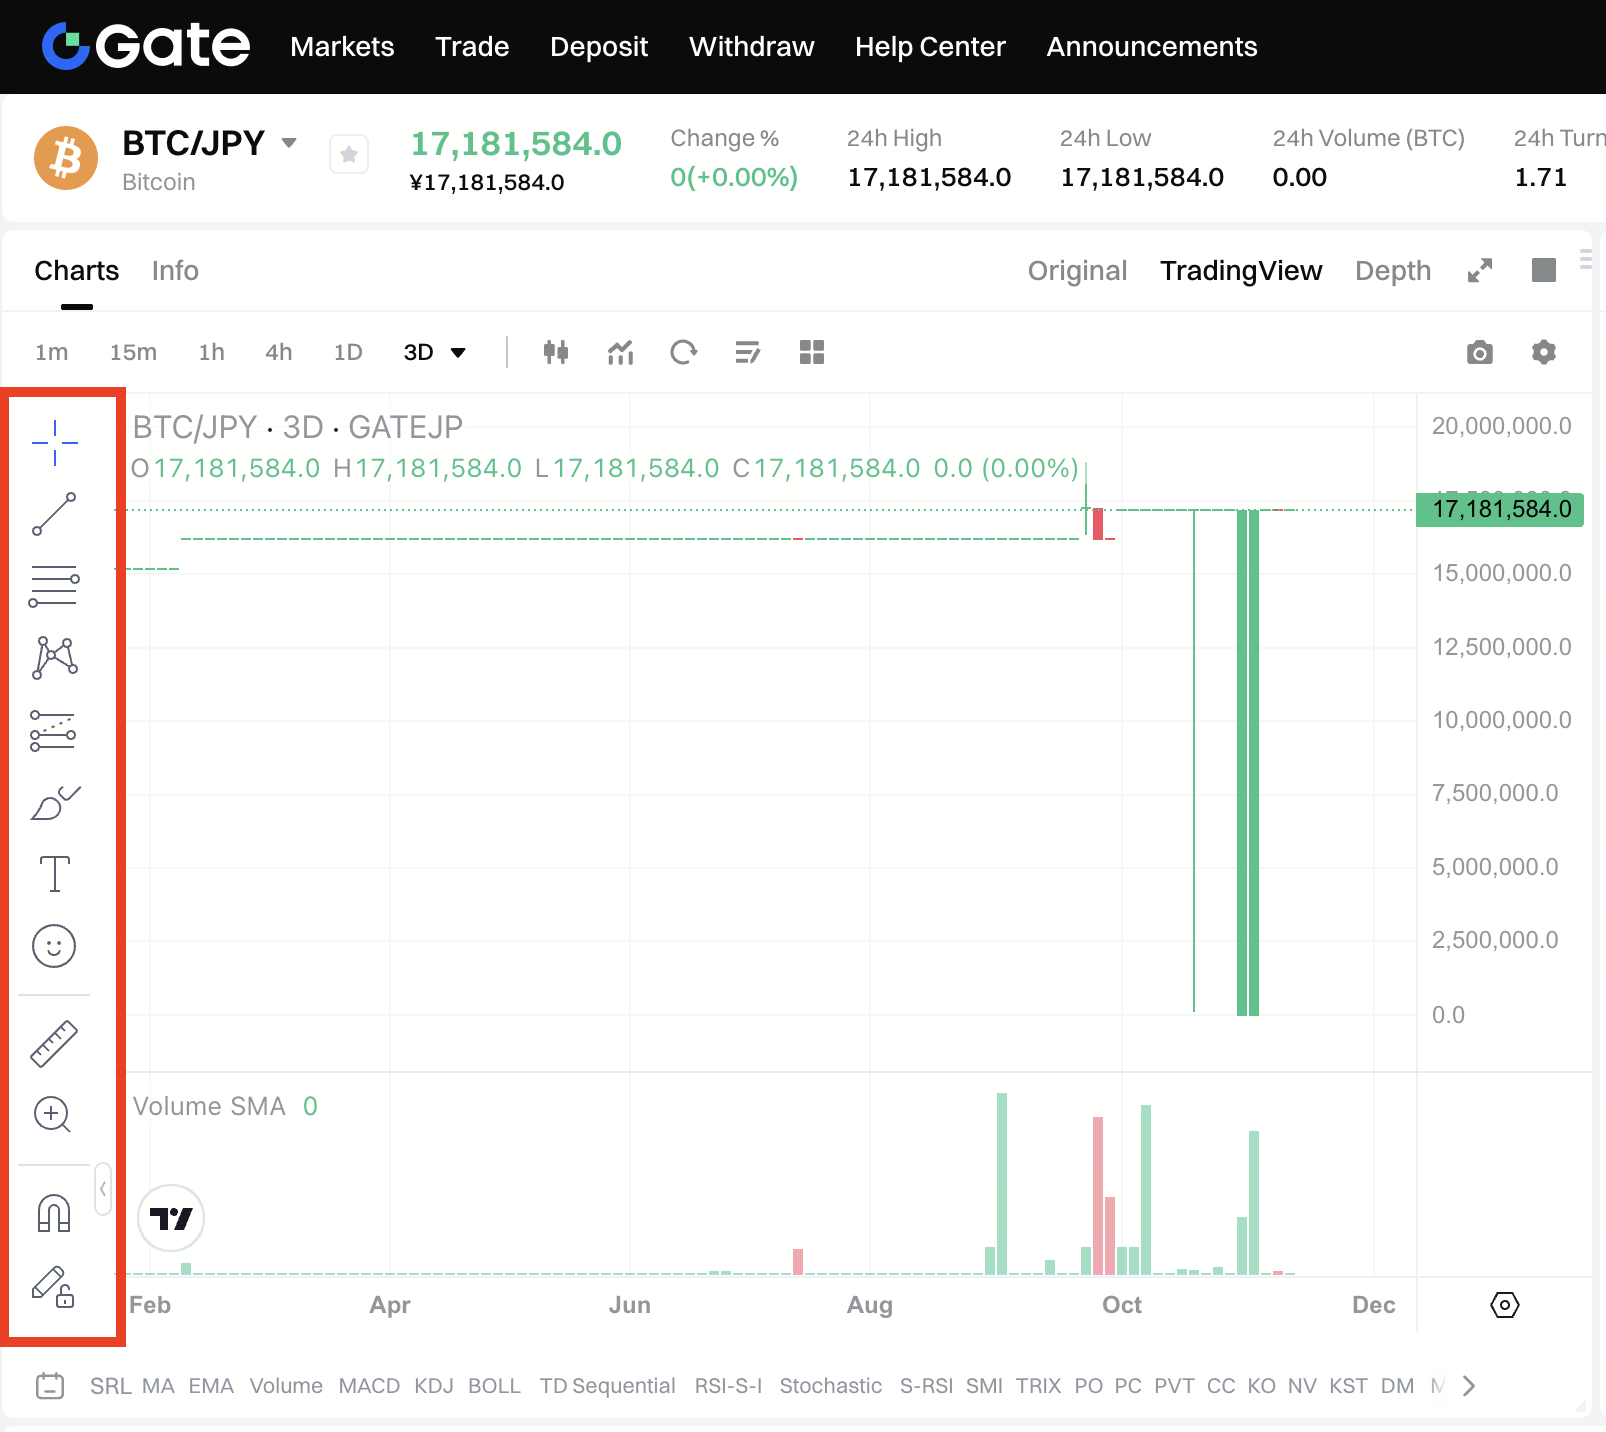
3. Switch Between 1-Chart and 4-Chart Layouts
Click the layout button to switch between 1-chart and 4-chart views.
When the window is expanded, you can switch between the trading pairs assigned to the four charts at the top of the interface.

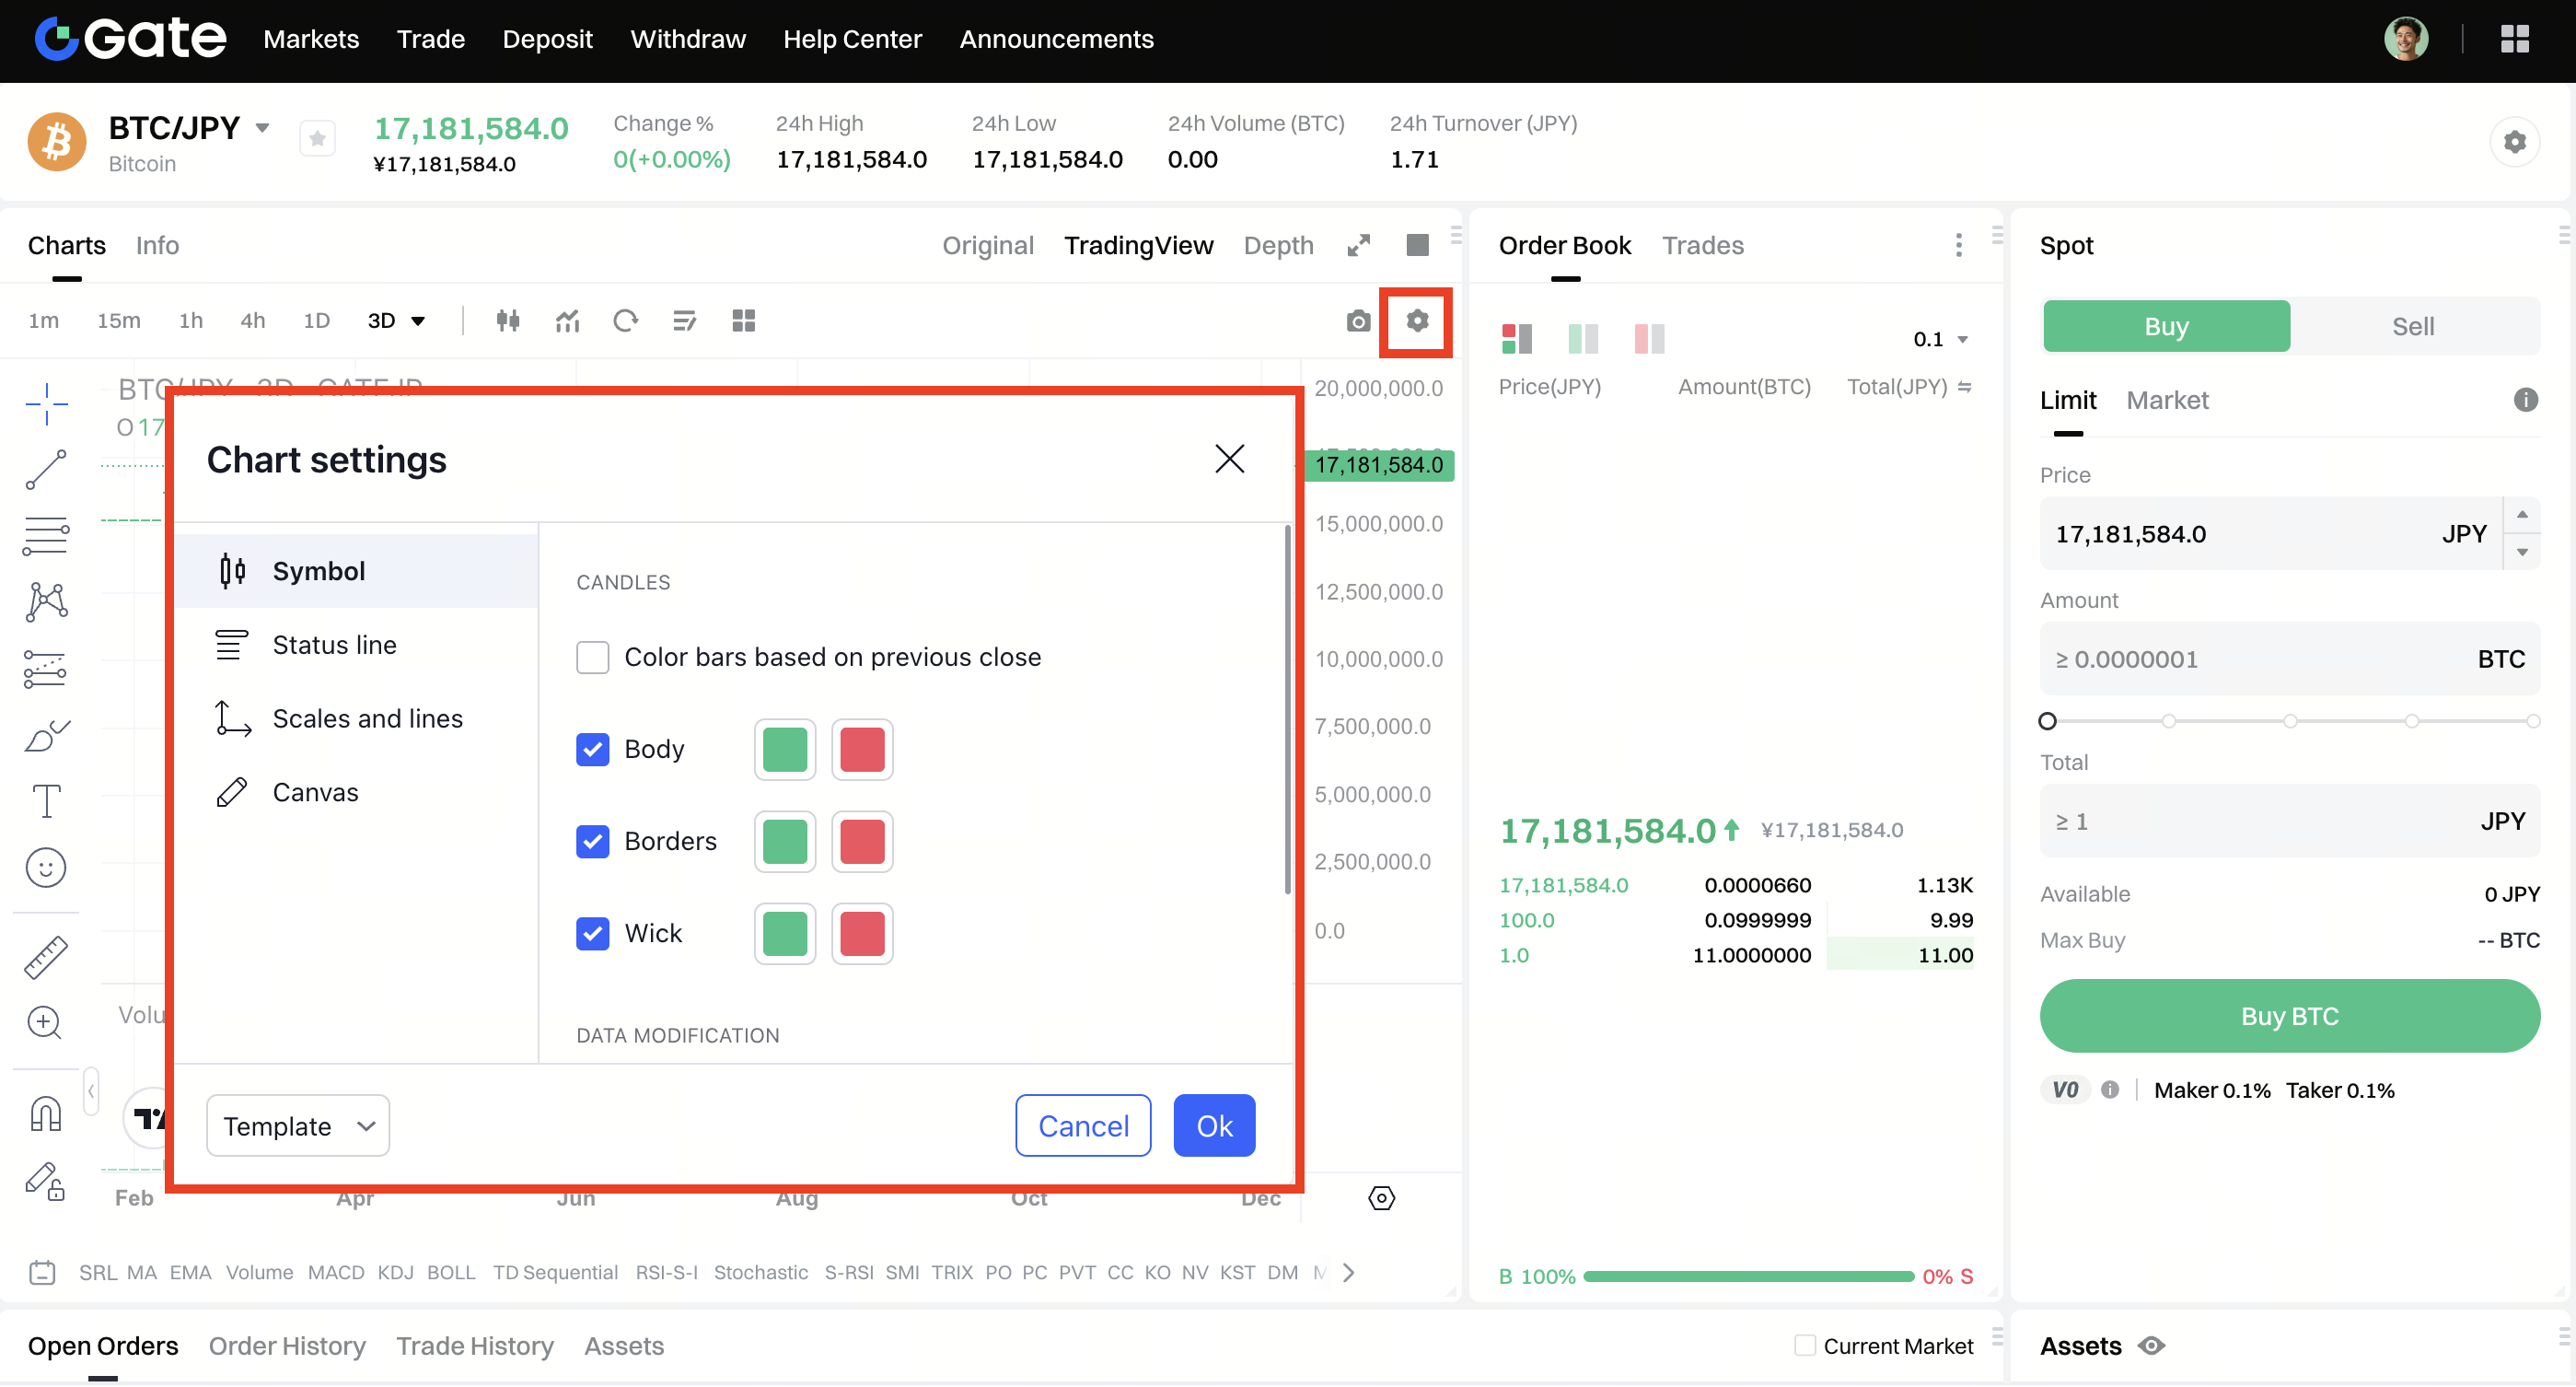
4. Customize Candle Colors
Click Chart Settings in the upper-right corner.
In the pop-up window, select the candle colors you want to modify.
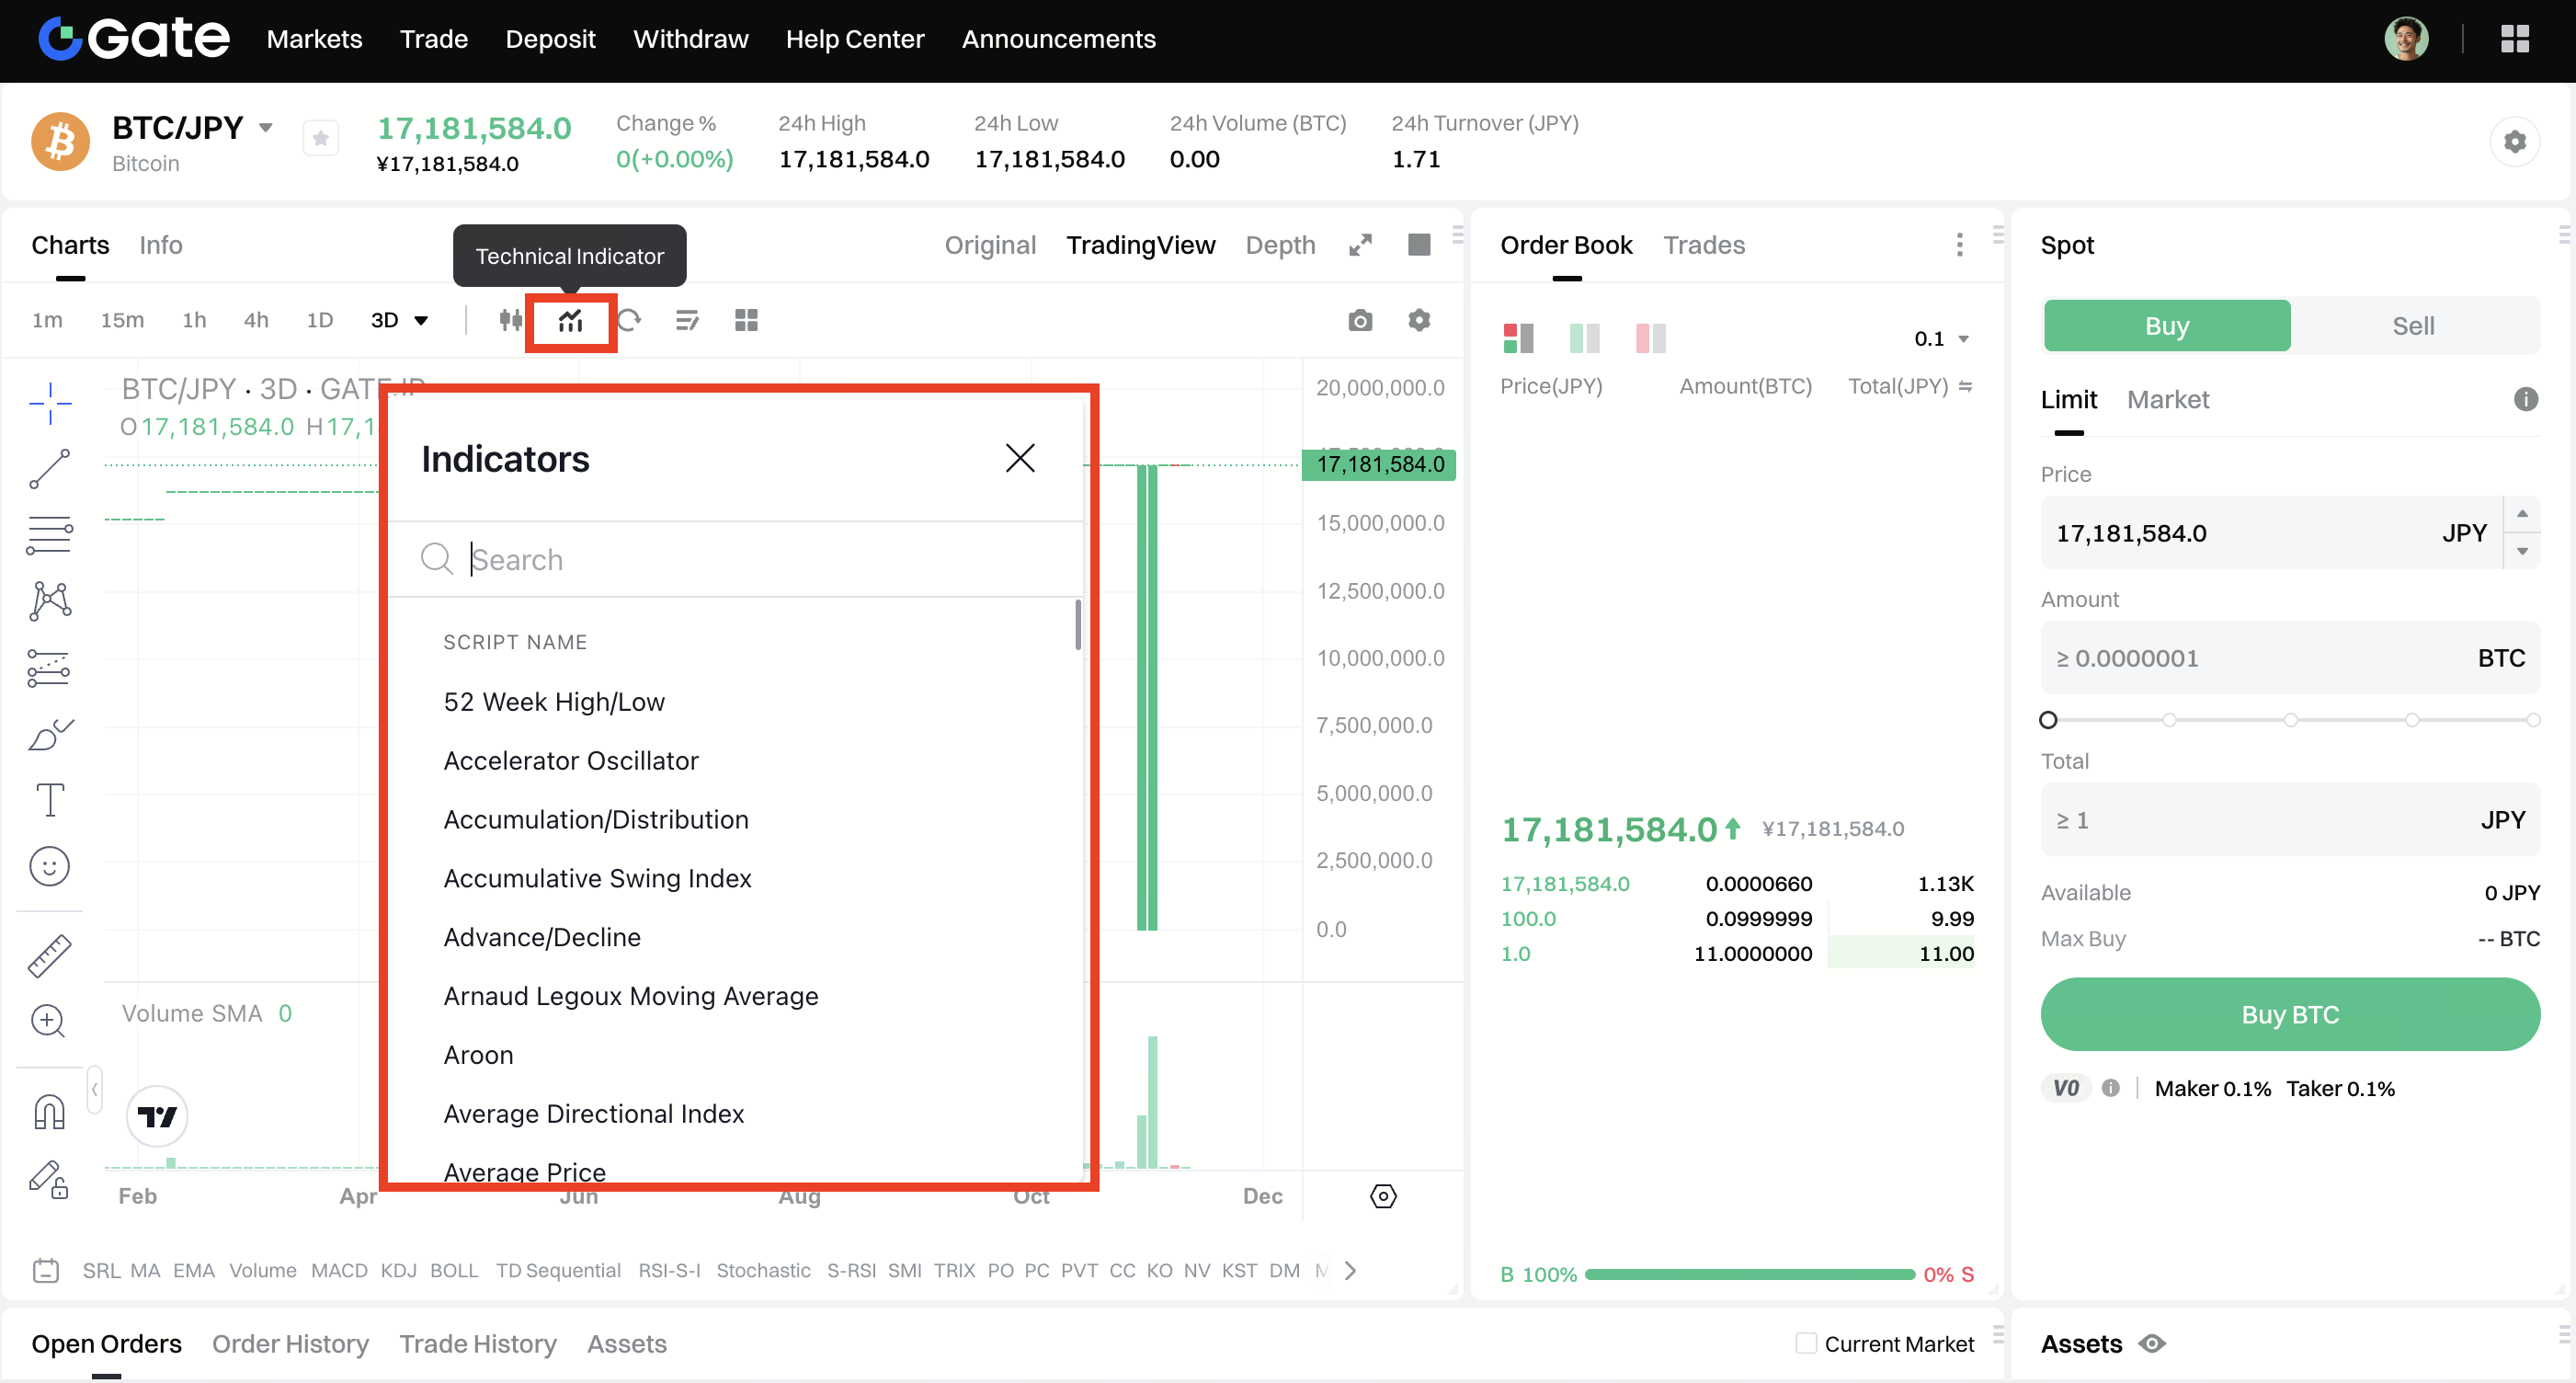
5. Add and Manage Indicators
- Click the Indicator icon.
- Search for Moving Average.
- Click the result to add the indicator.
- Click the gear icon to adjust the indicator parameters.
- Click the “x” icon to remove indicators that are no longer needed.
Note
If you log out and clear your browser cache, all chart settings will revert to their default values after you log in again.
