
In August 2026, the Solana ecosystem reached two major milestones. On-chain transaction volume hit a record 4.2 billion transactions in July, while cumulative net inflows into US spot Solana ETFs also surpassed the $1.22 billion mark during the month. On 24 August, daily net inflows reached $33.5 million, marking the strongest single-day performance in 2026 among the six US spot products.
However, another set of figures is equally striking. According to Gate market data , SOL is currently trading at around $102.83. Although it has rebounded by more than 40% from its July low, it remains approximately 65% below its all-time high of $293.31. ETF inflows continue to accumulate and on-chain activity has repeatedly reached new highs, yet the price remains far from its peak. This divergence provides an important lens through which to understand Solana's current market structure.
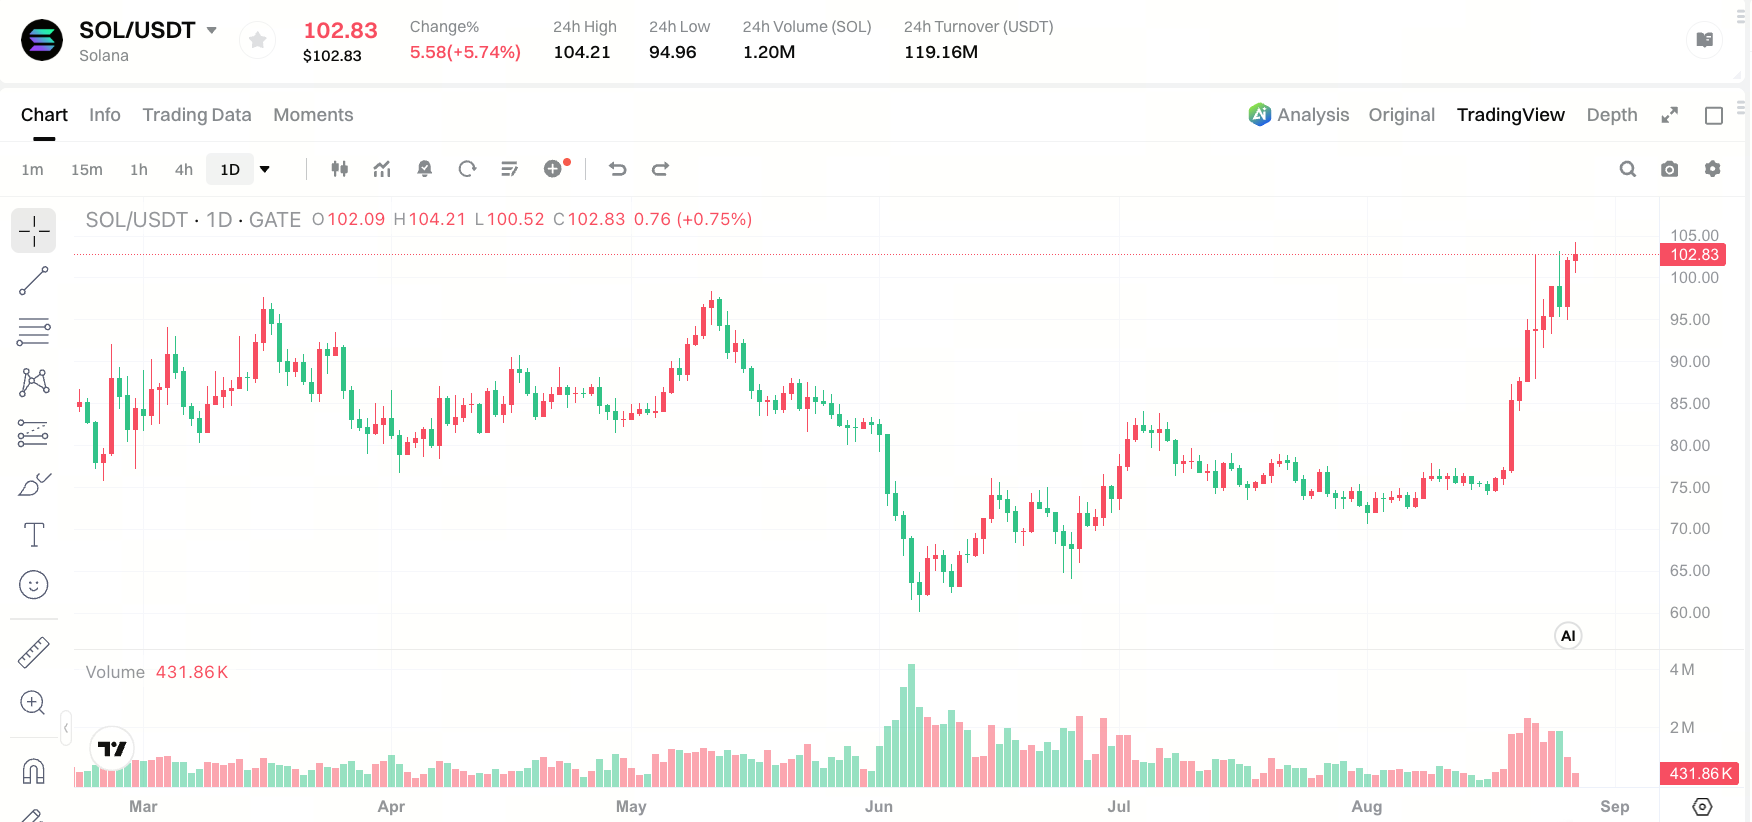
Source: Gate market data
The Product Landscape and Fund Distribution of Spot Solana ETFs
US spot Solana ETFs officially began trading in late October 2025. There are currently six products on the market. As of 26 August 2026, cumulative net inflows had reached $1.22 billion, with total net assets of approximately $1.262 billion, equivalent to 2.23% of SOL's total market capitalisation.
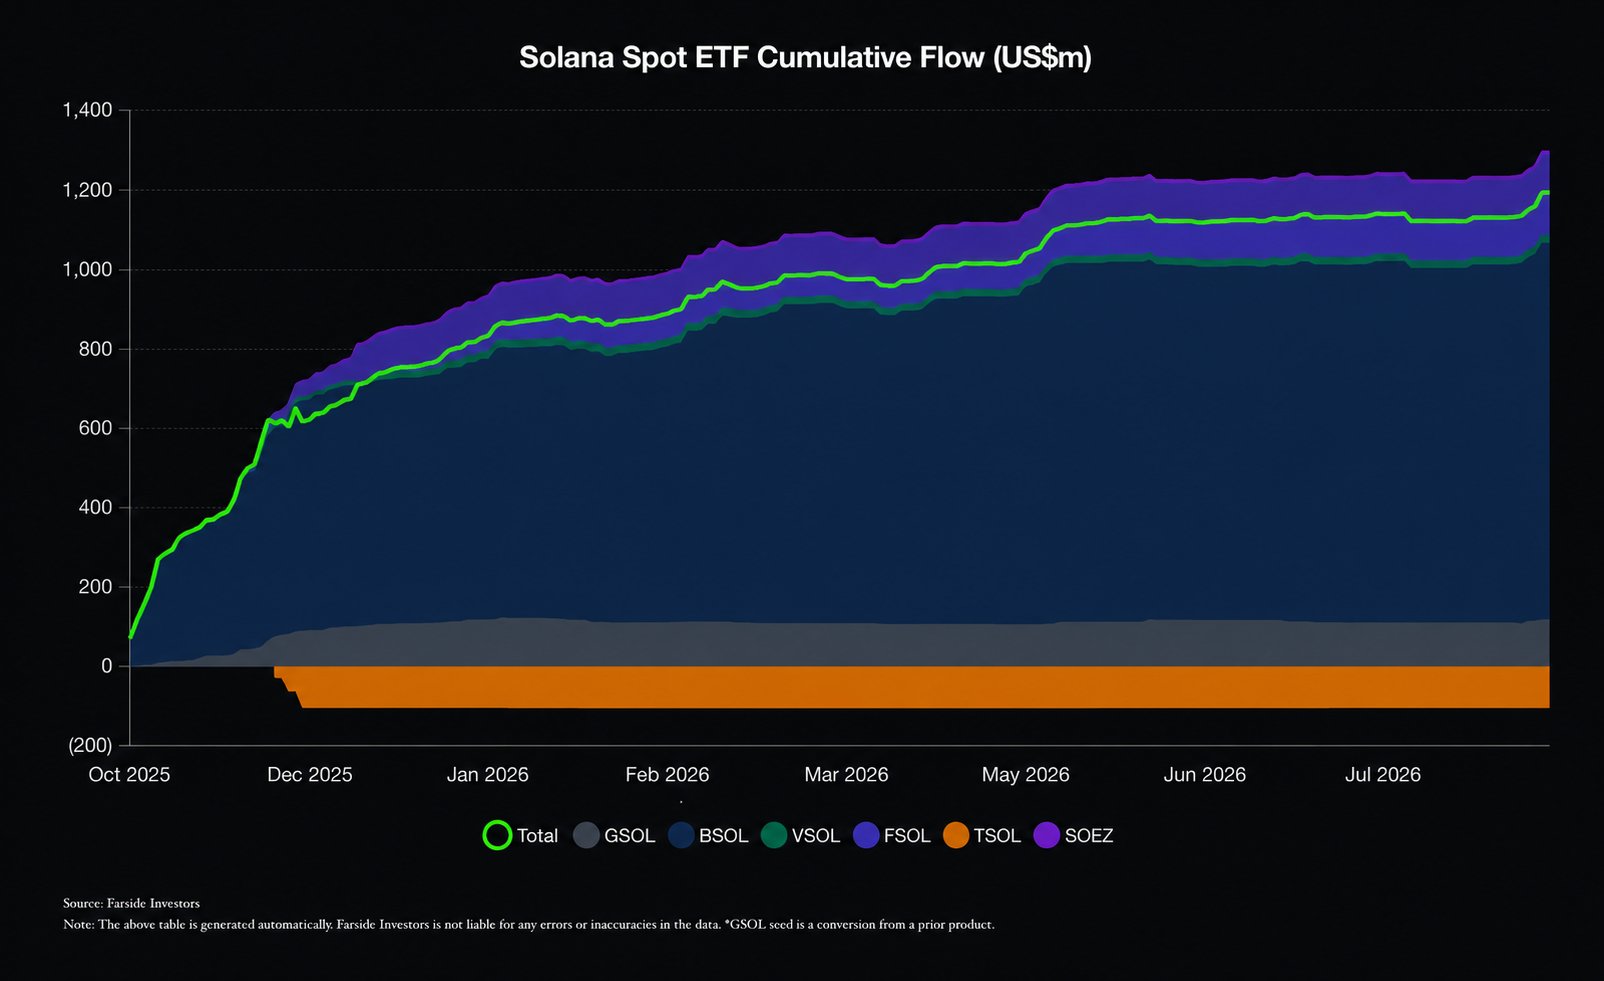
Source: X/@solana
Fund flows are highly concentrated. Bitwise's BSOL is the only Solana ETF incorporating a staking mechanism, with 100% of its underlying assets allocated to staking. This allows investors to gain exposure to SOL's price while also receiving an annualised staking yield of approximately 7%. This differentiated structure has helped BSOL stand out among competing products: its cumulative net inflows have reached approximately $971 million, accounting for around 80% of total ETF inflows. On 24 August alone, BSOL attracted $25 million in inflows, representing 74.6% of total inflows that day.
Other products remain considerably smaller. Fidelity's FSOL, Grayscale's GSOL and Morgan Stanley's MSOL are still catching up. MSOL recorded $5.51 million in inflows on 26 August, making it the second-largest inflow product that day. Tuttle's TSOL, meanwhile, has continued to face net outflow pressure since its launch.
The dominance of a single issuer creates a degree of concentration risk. If BSOL were to experience substantial redemptions or if Bitwise changed its product strategy, the overall ETF flow picture could be disproportionately affected. At the same time, BSOL's AUM approaching $1 billion and daily trading volume exceeding $100 million indicate that the product has already developed considerable liquidity and market depth.
Do $1.22 Billion in Inflows Translate Into Sustained Buying Pressure?
This is a key quantitative question. From a market microstructure perspective, ETF inflows do not necessarily equate to direct purchases of SOL in the spot market. ETF issuers create or redeem shares in the secondary market, involving spot transactions with authorised participants (APs). Nevertheless, sustained net inflows generally represent structural demand for SOL, and the transmission mechanism is broadly valid.
Several key factors, however, need to be considered.
First, inflows have not followed a linear growth trajectory. During the first two months after the products launched in October 2025, a large proportion of the cumulative capital entered the market. This was followed by roughly six months of net outflows or periods with little to no new inflows. The recovery in inflows since August has occurred against a backdrop of several weeks of minimal activity. At the beginning of the month, there were six consecutive days without additional net inflows. This suggests that the sustainability of the current inflow trend still needs to be established.
Second, the scale of inflows remains relatively limited compared with SOL's market capitalisation. The $1.22 billion in cumulative net inflows represents approximately 2.07% of SOL's current market capitalisation, a substantially smaller proportion than the share represented by US spot Bitcoin ETFs relative to BTC's market capitalisation. In terms of marginal price discovery, ETF flows are therefore not yet sufficient to become the sole dominant driver of SOL's price.
Third, short covering has likely contributed materially to the recent price rebound. In late August, the crypto market experienced significant short liquidations, with short positions liquidated across major exchanges exceeding $4 billion during the week of 24 August alone. SOL rose by approximately 40% over eight days, a pace that is broadly consistent with the characteristics of a short-covering rally, where upward price movement is driven by the closure of short positions rather than solely by the opening of new long positions.
On-Chain Fundamentals: Record Activity Diverges From Price
There is little debate that Solana's on-chain data has remained strong in 2026.
In July, the Solana network processed 4.2 billion transactions, up 13.5% from June and 91% from December 2025. Solana's official account responded to the milestone with a single word: "Higher." Part of this growth followed the activation of the SIMD-0286 upgrade on 29 July, which increased the block compute-unit limit from 60 million to 100 million and raised block capacity by 66%.
Real-world assets (RWAs) on-chain have also expanded rapidly. By late August, the total value of RWAs on Solana had reached approximately $4 billion, with more than 350,000 holding addresses. Both figures were higher than the approximately $3.73 billion in RWA value and 313,000 addresses recorded at the end of July. Solana has now surpassed Ethereum in the number of RWA holders, making it one of the leading networks in this segment.
Another factor that cannot be overlooked is memecoin trading. In mid-August, weekly spot trading volume for memecoins on Solana reached $5.2 billion, the highest level in 2026, and nearly double the $1.8 billion low recorded in late May. During the week of 20–26 July, memecoins accounted for 29% of Solana's spot DEX trading volume, with their share rising as high as 42% on some individual days.
However, surging on-chain activity does not always translate into a proportional increase in SOL's price. Memecoin trading activity largely reflects capital rotation and speculative activity within the ecosystem rather than large-scale new capital flowing directly into SOL. The fact that on-chain transaction volume can reach record levels while SOL remains around 60% below its ATH highlights an important point: network activity and token price do not have a simple linear relationship.
Why Has the Price Failed to Keep Pace?
Taken together, the factors above provide a systematic explanation for the apparent contradiction between record ETF inflows and SOL's significant distance from its ATH.
The first factor is supply-side pressure. SOL's circulating supply currently stands at approximately 624 million tokens, representing substantial inflationary dilution compared with the previous bull-market cycle. Although Solana's inflation rate declines over time, ongoing issuance remains a structural factor that can weigh on price. SOL traded at approximately $202 one year ago, meaning its current price is around 50% lower than it was a year earlier. Part of this decline can be attributed to growth in the circulating supply.
The second factor is market structure. When SOL reached its previous high of $293, the broader crypto market was operating in an environment characterised by exceptionally loose liquidity and strong risk appetite. While the current macro liquidity environment has improved, it has not yet returned to the levels seen towards the end of 2024. A return to the ATH would therefore likely require a broader and more sustained improvement in risk appetite across the crypto market, rather than relying on ETF flows alone.
The third factor is the nature of the capital entering ETFs. Current ETF flows are dominated by BSOL, which combines SOL price exposure with staking-related yield potential. This means that some inflows may be driven by yield-oriented allocation rather than purely directional bullish positioning. Such capital may potentially be more persistent, but its immediate impact on price could be more moderate.
Can Institutional Demand Become a Catalyst?
The impact of ETF flows on SOL's price perhaps should not be measured by whether they can immediately push the token back to its ATH. A more appropriate framework is to ask whether the introduction of ETFs is improving SOL's market structure and creating a more mature mechanism for long-term price discovery.
From this perspective, $1.22 billion in cumulative inflows and BSOL's AUM approaching $1 billion indicate that SOL has entered the asset-allocation universe accessible to traditional financial institutions. Regardless of the absolute scale, this represents an important structural development: SOL is increasingly being incorporated into mainstream financial-market products alongside Bitcoin and Ethereum.
The Solana network itself is also continuing to evolve. Progress towards the Alpenglow upgrade is expected to further enhance network performance, while the increase in block capacity has already strengthened the infrastructure available for high-throughput applications. The expansion of the on-chain RWA ecosystem and the growth in the number of holders also suggest that Solana is gradually broadening beyond its image as primarily a memecoin-focused network towards a more diverse range of applications.
In the short term, whether SOL can challenge its ATH will depend on the sustainability of ETF inflows, the direction of macro liquidity and the recovery of broader risk appetite across the crypto market. SOL has now moved above the psychologically important $100 level, while technical resistance is currently located around the $101–$103 range. If the daily close can remain above this area, it could potentially create room for further upside.
More importantly, SOL's market narrative may be shifting from a "speculative asset associated with the memecoin ecosystem" towards an "underlying asset accessible through institutional investment products". Whether this narrative transition proves durable will require validation over the coming quarters, including whether ETF flows can remain positive, whether products from other issuers can reduce the current concentration around BSOL, and whether non-speculative applications such as on-chain RWAs can continue to expand.
Conclusion
Cumulative inflows of more than $1.2 billion into Solana ETFs represent an important milestone in the broader trend of institutional digital-asset allocation. It indicates that SOL is moving from a predominantly community-driven asset towards one with greater access through institutional investment products. However, a return to the ATH is a complex market-structure question that requires macroeconomic conditions, market liquidity and network fundamentals to align.
SOL is currently trading at approximately $102.87, still around 65% below its ATH, but it has rebounded by more than 40% from its July low. Key fundamental indicators, including on-chain transaction volume, RWA value and stablecoin supply, are all showing an upward trend. The performance of ETF flows during the final week of August will be an important window for assessing whether the latest inflow recovery has the potential to become more sustained.
Institutional participation may be an important condition for a potential repricing of SOL, but it is far from sufficient on its own. A sustained challenge to the ATH would likely require multiple market and fundamental conditions to align.
FAQ
Q1: How much cumulative capital has flowed into spot Solana ETFs?
As of 26 August 2026, the six US spot Solana ETFs had recorded cumulative net inflows of $1.22 billion. Bitwise's BSOL accounted for approximately 80% of the total, with cumulative inflows of around $971 million.
Q2: Why is SOL still well below its all-time high despite record Solana ETF inflows?
Key factors include dilution from growth in circulating supply, a broader macro liquidity environment that has not returned to previous peak levels, some ETF inflows being driven by staking-related yield potential rather than purely directional positioning, and the concentration of current inflows in a single issuer's product. SOL is currently trading at approximately $102.87, around 65% below its all-time high of $293.31.
Q3: Why does Bitwise's BSOL dominate the Solana ETF market?
BSOL is the only spot Solana ETF currently incorporating a staking mechanism. Investors can gain exposure to SOL's price while also receiving an approximately 7% annualised staking yield. Combined with its 0.20% management fee, this differentiated structure may make BSOL particularly attractive to institutional investors seeking both market exposure and staking-related income.
Q4: What are the latest on-chain fundamental metrics for Solana?
In July 2026, Solana processed 4.2 billion on-chain transactions, a new record, representing a 13.5% month-on-month increase and a 91% increase from December 2025. The value of RWAs on Solana reached approximately $4 billion, with more than 350,000 holding addresses.